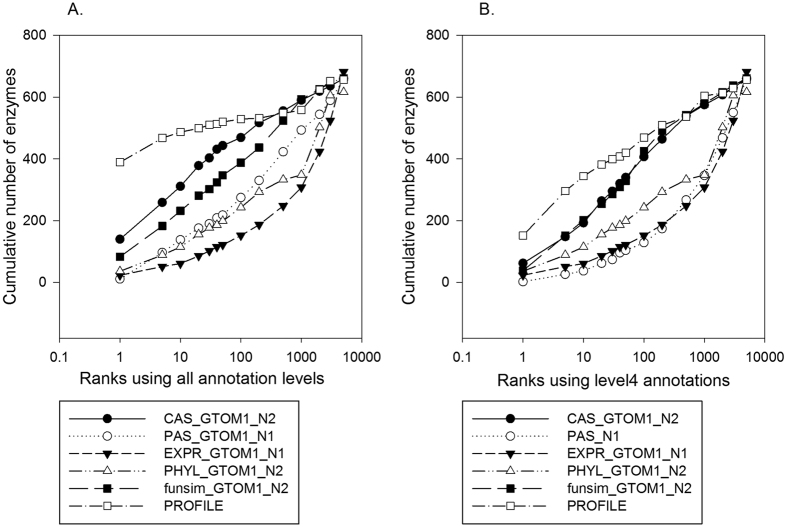
Figure 5. Performance comparison of individual feature scores.
Best performing form among six variations (Eqns 7 and 8) from CAS, PAS, EXPR, PHYL, funsim as well as PROFILE were compared in terms of ranks of correct enzymes at each EEN position. N1 and N2 in the figure legend stand for k = 1 and 2 for Rel_Score. (A) Feature scores computed using the original GO annotations. MRR for CAS, PAS, EXPR, PHYL, funsim, and PROFILE were 0.294, 0.077, 0.055, 0.096, 0.191, and 0.617, respectively. (B) Scores computed using parental GO terms mapped at the 4th level. MRR for CAS, PAS, EXPR, PHYL, funsim, and PROFILE were 0.156, 0.024, 0.055, 0.096, 0.134, and 0.314, respectively.

