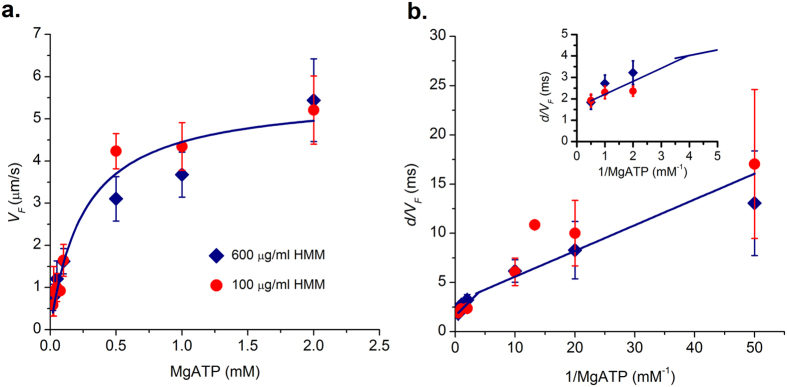
Figure 7.
(a) Velocity of actin filament as a function of ATP at two different HMM densities; 100 μg/ml (circle) and 600 μg/ml (diamond). Solid line is Michaelis-Menten fit to filament velocity for a range of [MgATP]. Vmax and Km correspond to 5.5 ± 0.3 μm/s and 0.3 ± 0.03 mM respectively. (b) Double reciprocal plot of (a); value of d = 10 nm was used in the calculations. Data could be described using two linear fits for high and low ATP conditions. At high ATP (>0.5 mM) we calculated k−ADP = 625 ± 139 s−1 and k+ATP = 1.6 ± 0.14 × 10⁶ M−1 s−1 using equation 4. At low ATP (<0.5 mM) we calculated k−ADP = 356.6 ± 74.6 s−1 and k+ATP = 3.09 ± 0.24 × 10⁶ M−1 s−1. Inset shows the points and fit at high ATP for better visualization. Each point corresponds to an average from three different experiments with 30 filaments each. Error bars denote standard error.

