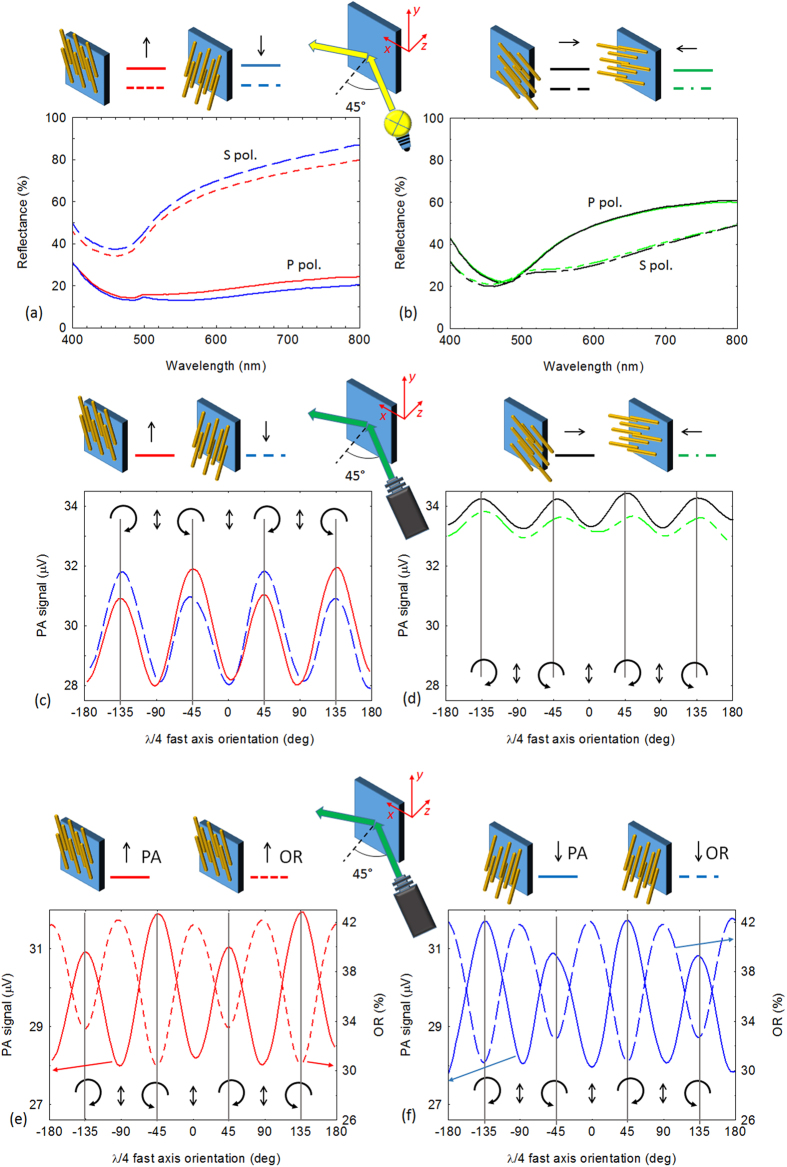
Figure 2. Linear optical measurements.
(a) Reflectance spectra at a 45° angle of incidence with the wires mainly oriented perpendicular to the plane of incidence, red curve with tip of the wires oriented upward, blue curve downward (solid lines P pol., dashed lines S pol.); (b) Reflectance spectra at a 45° angle of incidence with the wires mainly oriented in the plane of incidence, green curve with tip of the wires oriented away from the incident light, black curve with tip of the wires oriented in the opposite direction (solid lines P pol., dashed lines S pol.); (c) Photoacoustic signal (PA) at 45° angle of incidence on sample with vertically oriented nanowires, red solid line with wire ends pointing up, blue dashed line for wires oppositely pointed; (d) Photoacoustic signal (PA) at 45° angle of incidence on sample with horizontal oriented nanowires, green dashed line with wire ends pointing away the incidence light, black solid line with wires in the opposite direction; (e) A comparison of photoacoustic absorbance (PA) signal and optical reflectance (OR) at 45° angle of incidence with nanowires pointing up (PA solid red line, OR dashed red line); (f) PA and OR signals with downward wires pointing down (PA solid blue line, OR dashed blue line). On the top of each panel a schematic illustration of experimental sample and laser beam orientation with respect to the nanowire orientations.

