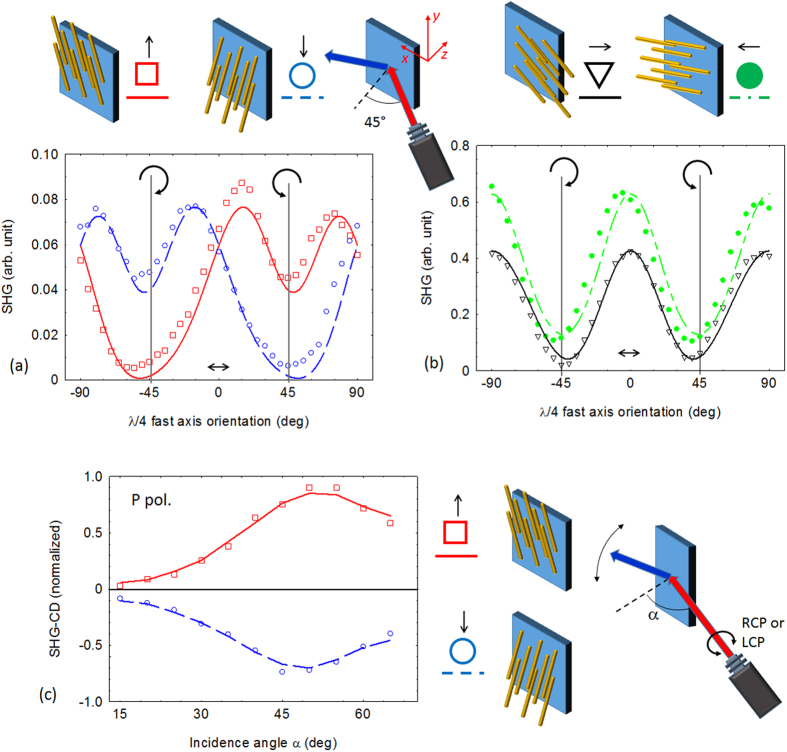
Figure 3. Nonlinear measurements.
(a) SHG P-pol. signal generated in reflection configuration when the pump field impinges at 45° angle of incidence, the nanowires are oriented as indicated on the top illustrations. The lines are curve fits obtained by using Eq. 9 and the models in the method section; (b) SHG signal for sample with nanowire orientations indicated on the top illustrations. The lines are curve fits again obtained from Eq. 9 and the models in the method section. The difference in intensities between the two curves is due to the different Fresnel coefficients (see Eq. 10); (c) normalized SHG-CD measurements (see Eq. 2) as a function of the angle of incidence α; (a) red squares with nanowire ends pointed up, blue circles with nanowires oppositely oriented. The lines are guides for the eyes.

