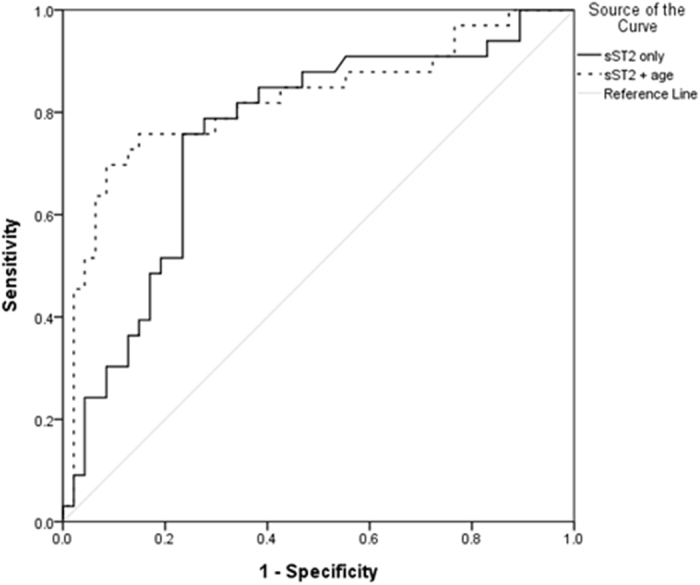
Figure 1. ROC curve for discriminating patients with or without carotid plaque (n = 80).

The 2 independent risk factors in the multivariate analysis (sST2 and age) were used to generate a combined predictive score for plaque using logistic regression. Line: Plasma sST2 level only; AUROC: 0.757 (95% CI: [0.646, 0.867]; P < 0.001); Dots: Predictive value combined by plasma sST2 level and age; AUROC: 0.823 (95% CI: [0.723, 0.924]; P < 0.001).
