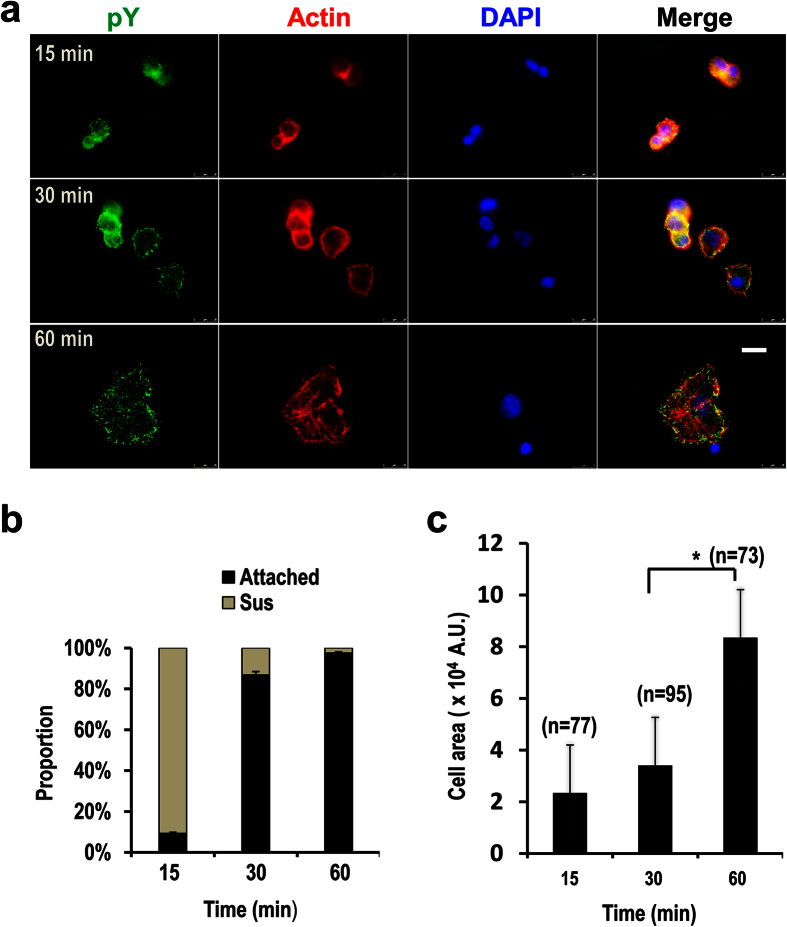
Figure 1. Determination of the early and the active spreading stages of migratory cells.
(a) ECV-304 cells were seeded on 5 μg/ml fibronectin coated cover glass and allowed to attach and spread. The cells were fixed at indicated time points and stained with anti-pY antibody, Alexa 546 phalloidin (for actin), and DAPI (for nuclei). Scale bar: 25 μm. (b) The proportions of the attached cells (Attached) versus the floating cells (Sus) at each time point as indicated during the time course of cell attaching and spreading. The error bars represent standard deviations. (c) The areas of attached cells in (a) were quantified using MetaMorph. The significance of difference was determined by non-paired Student’s t-test. The number of cells used for quantifying the areas at each time point is shown above each bar. Error bars: standard deviations. *p < 0.05.

