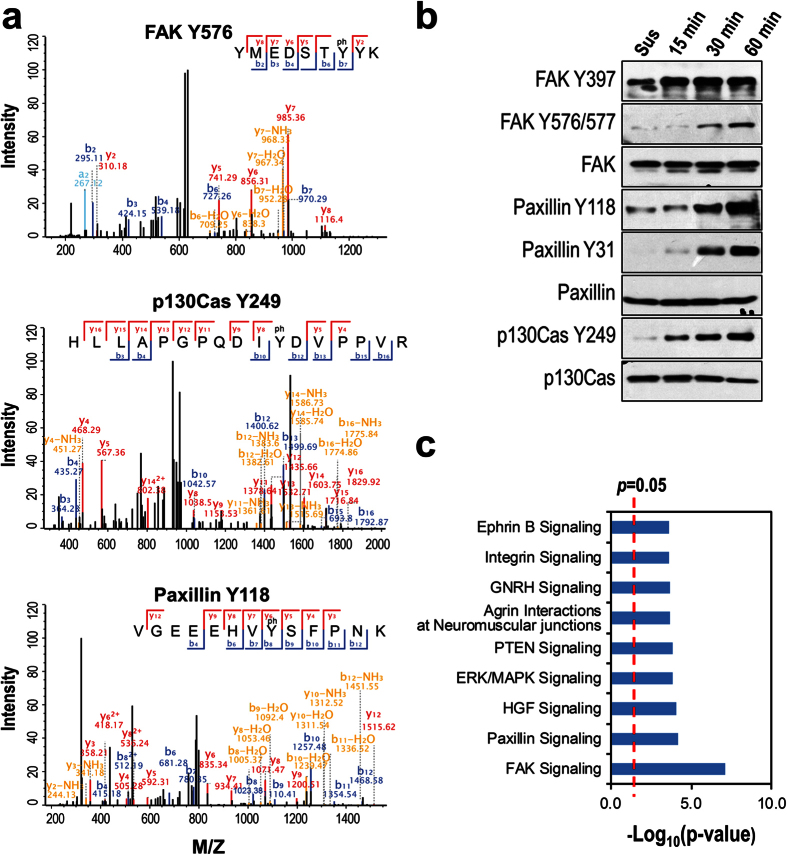
Figure 5. Identification of pY sites.
(a) The spectra show the identification of specific pY sites on FAK, p130Cas, and paxillin. (b) Western-blotting detection of the specific pY sites in the two spreading stages, the corresponding proteins were also probed as the loading control. (c) Canonical pathways enriched in the proteins with identified pY sites as predicted by IPA analysis. X-axis: the logarithm-transformed p-value.

