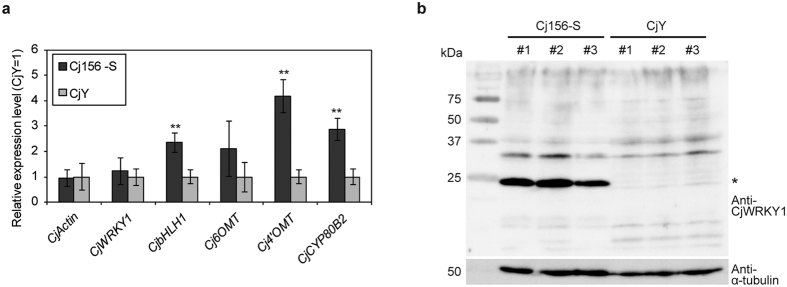
Figure 1. Expression of CjWRKY1 and the biosynthetic enzyme genes in Cj156-S and CjY cells.
(a) Transcripts of CjWRKY1 and the other biosynthetic enzyme genes in 2-week-cultured cells were measured by quantitative RT-PCR. The relative expression levels were estimated by the standard curve method with three biological replicates and standardized with the α-tubulin gene as an internal control. The average value of the CjY was set as 1. The data are shown as the mean ± s.d., **p < 0.01, Student’s t-test. (b) CjWRKY1 accumulation in three independent cultures grown for 2 weeks. An asterisk indicates CjWRKY1 protein. Left axis indicates the size of reference proteins. kDa; molecular mass in kilodaltons.

