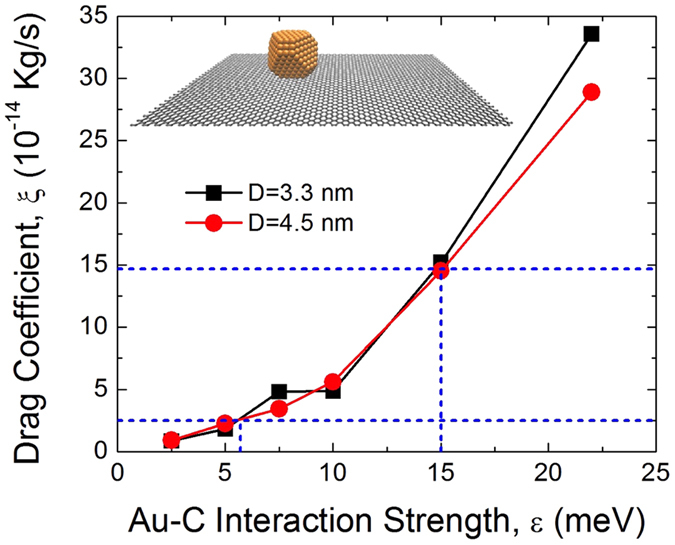
Figure 4. Calculated drag coefficient as a function of the interaction strength between graphene and gold nanocrystals with 3.3 and 4.5 nm diameters; inset is a snapshot of the simulation.

Dashed lines indicate the range of the drag coefficients determined from the measured slip time.
