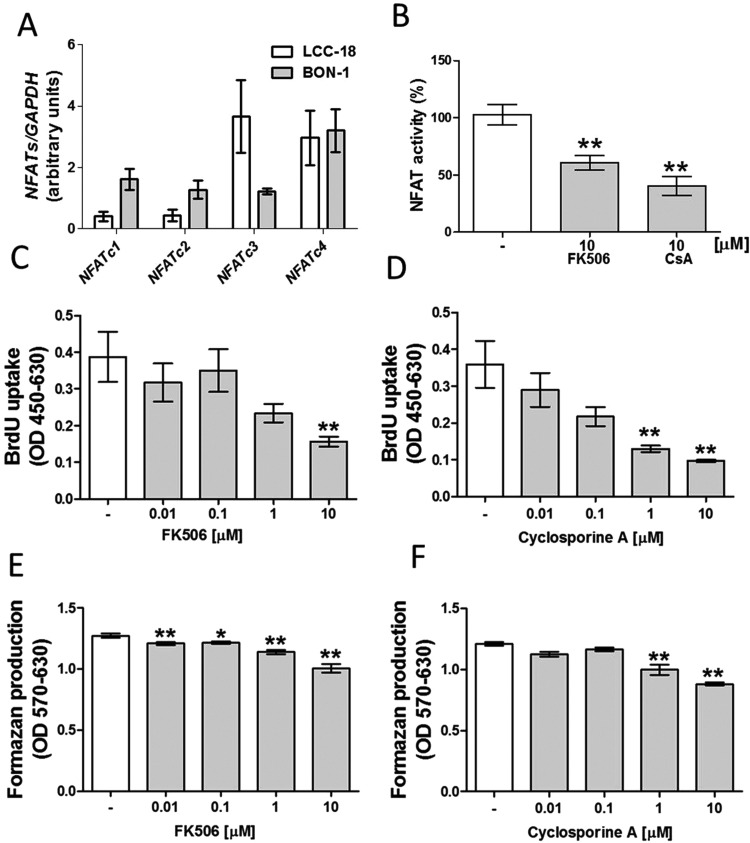
Figure 4. Effects of NFAT suppression on BON-1 cells proliferation.
(A) Expression of NFATs in BON-1 and LCC-18 cells. (B) NFAT activity in BON-1 cells treated with 10 μM FK506 or 10 μM CsA for 24 h. BON-1 cell proliferation treated with FK506 (C) or CsA (D) for 24 h. The number of viable BON-1 cells assed after 24 incubation in the presence of FK506 (E) or CsA (F). Results are the mean ± S.E.M., obtained from at least n=4.

