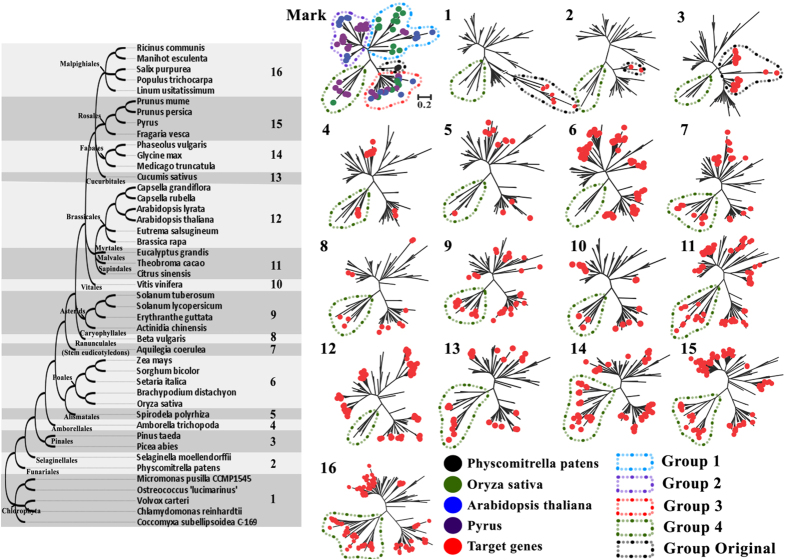
Figure 2. Phylogenetic analysis for plant GLRs evolutionary history.
Protein phylogenetic analysis using the Maximum Likelihood, The sequences were aligned using MUSCLE. The bootstrap consensus tree was generated using the JTT matrix-based model with discrete gamma distribution by MEGA5 from 1000 bootstraps. An unscaled tree showing the phylogenetic relationships of 45 plant species was illustrated on the left, we divided this plant system into 16 parts according to the plant taxonomy. The right part is phylogenetic analysis for each part of plant species’ GLRs, we take moss (lower plant), rice (endogen plant), Arabidopsis (dicotyledonous herbs), pear (dicotyledonous woody) as marker genes to construct phylogenetic tree for each part plant species, then novel 881 sequences were collected and all plant GLR genes subfamily were classified. The scale bar is 0.2 for all phylogenetic trees. The non-circular labelled branches in 1~16 part phylogenetic trees are mark genes in Mark phylogenetic trees, all these mark genes in 1~16 part phylogenetic trees are location consistency with Mark phylogenetic trees.

