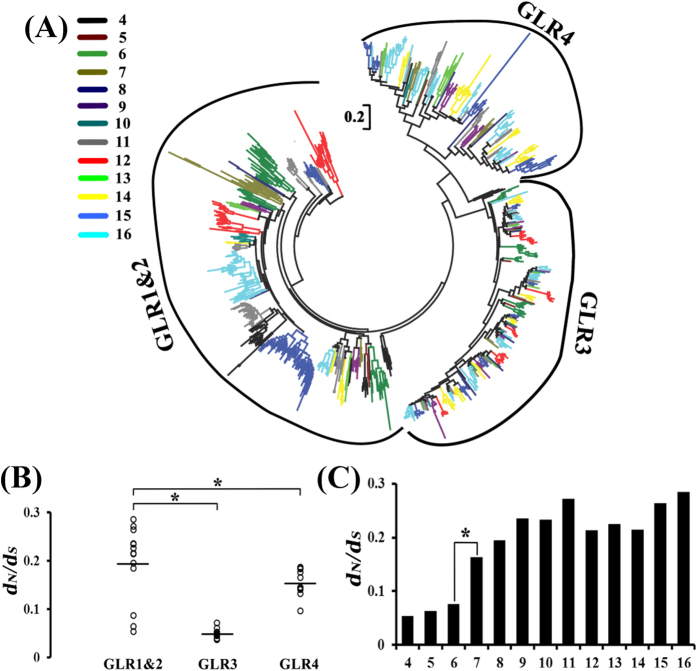
Figure 6. Species-specificity of GLR1&2 subfamily was evolved under selective forces.
(A) Phylogenetic relationships of the all angiosperm GLRs shown in (Table S2). Each colour represents a part of GLR proteins as description in Fig. 2. The sequences were aligned with PRANK and the ML tree was built with MEGA5 under JTT matrix-based model with 1000 bootstraps. The scale bar is 0.2. GLR1&2 subfamily showed a species-specific distribution in this phylogenetic analysis. (B) Distribution of selective forces of three GLR subfamilies estimated for all angiosperm species. Selective forces acting on plant GLRs by calculating the ratio of nonsynonymous to synonymous nucleotide substitution rates (dN/dS, ω). The median dN/dS values of GLR1&2 were significantly higher than GLR3 and GLR4 (p < 0.01, Wilcoxon rank-sum tests). The horizontal line representative the median dN/dS values. (C) Histogram of dN/dS rates of GLR1&2 subfamily estimated for all angiosperm species which was devised into 13 parts as description in Fig. 2. The ω were remarkable elevated beginning from Ranunculales (p < 0.01, Wilcoxon rank-sum tests), which was the first stem eudicotyledonous order of plant species analysed.

