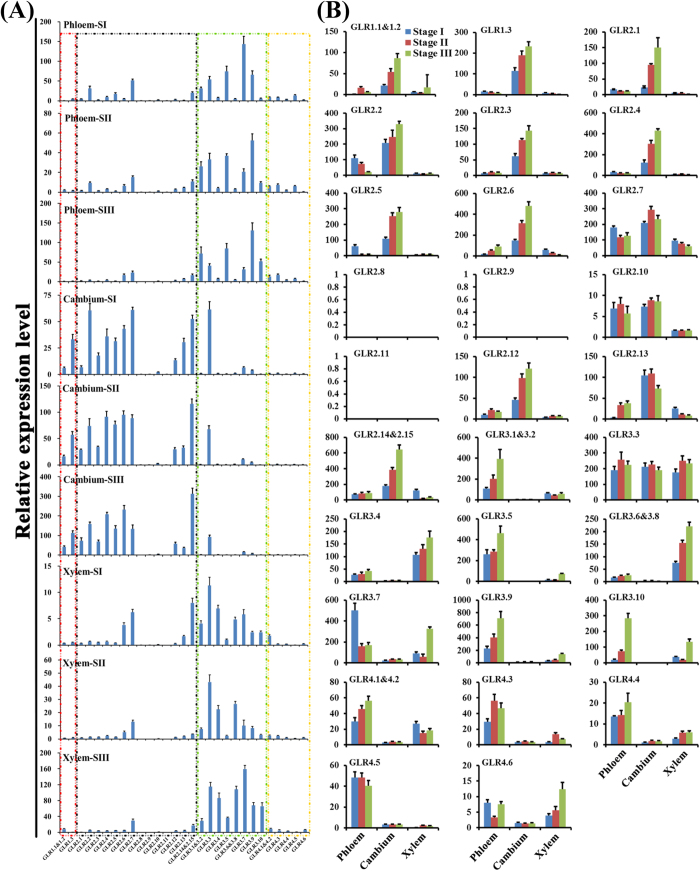
Figure 8. Temporal-spacial expression patterns of pear GLRs in stem vascular tissues by qRT-PCR.
Xylem, phloem and cambium samples from three stages stems, which having increased lignification, were selected to determine different PbrGLRs expression levels. (A) The pear GLR gene family’s expression patterns in a single tissue. SI, SII and SIII denoted Stage I, Stage II and Stage III, respectively. Stage I: The stem above cotyledons from 90 days old pear tree; Stage II: The stem from the current growth branches of 8 years old pear tree. Stage III: The stem from the last year the branches of 8 years old pear tree. The stages were detail described in Fig. S5. The different color of dotted boxes were represented four subfamilies of pear GLRs. (B) The expression patterns of a single pear GLR gene in all analyzed vascular tissues. An amplified PbrTub-2 and PbrEF1α were used as internal control. Samples were taken in at least triplicate reduplicate of biological, the average of which is show.

