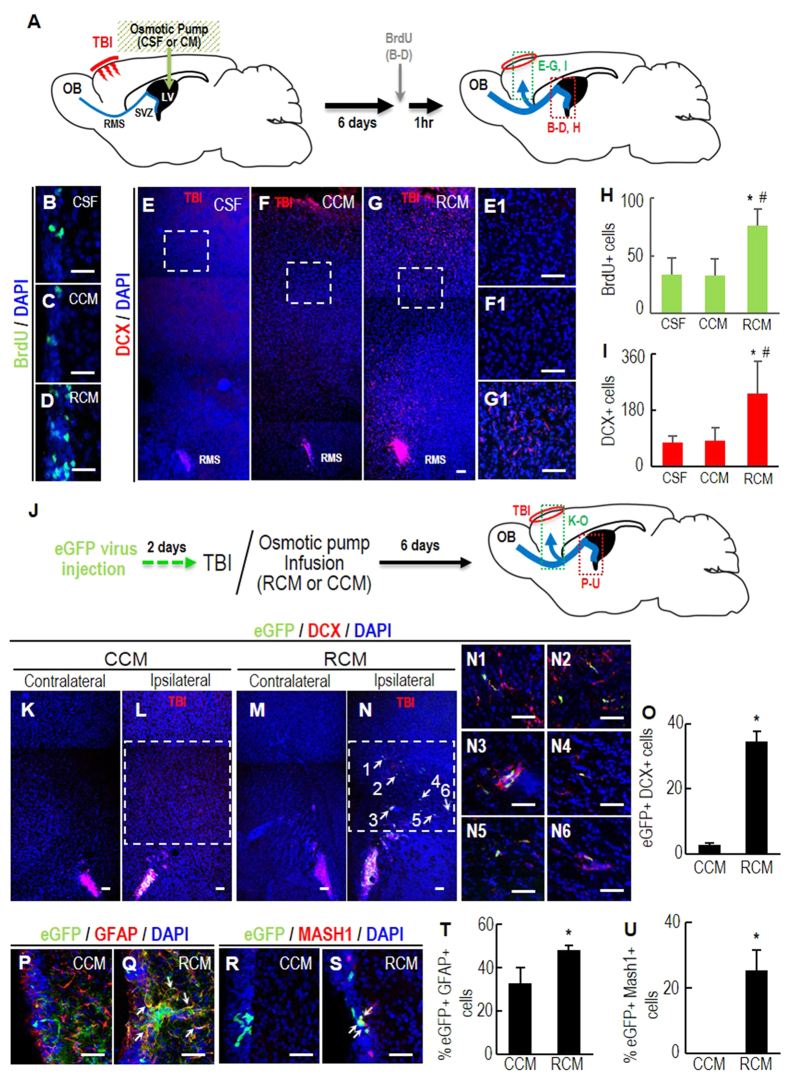
Figure 6. Enhanced SVZ-NSC neurogenesis and neuronal migration to the damaged brains by RCM treatment.
(A) Schematic presentation of the experimental procedure in (B–I). Cryogenic TBI was applied to the right cortical brain and followed by infusion of CM (or CSF) into ipsilateral LV. All analyses were carried out 6 days after TBI. (B–D,H) SVZ-cell proliferation determined by the numbers of cells immunoreactive for BrdU 1 hr after BrdU injection. (E–G,I) Numbers of DCX+ neuroblasts migrating to the TBI region. (E1–G1) High-powered images of the boxed areas in E-G. Significantly different from the CSF(*)- and CCM (#)-infused animals at p < 0.001. n = 5 (CSF), 7 (CCM), and 7 (RCM) mice. Scale bars, 50 μm. (J–U) SVZ-NSC origin of the migrating neuroblasts confirmed by labeling SVZ-NSCs with eGFP. (J) Schematic presentation of the experimental procedure in (K–U). Two days prior to the TBI (and CM infusion), eGFP-expressing retroviruses were injected to the right SVZ. Six days after TBI, eGFP+/DCX+ cells in the migrating areas (in green box, (K–O) and (B,C) type cells in the ipsilateral SVZs (in red box, P–U) were counted. Shown in (K–N) are representative ipsilateral and contralateral (negative control) brain sections of RCM- and CCM-infused mice. (N1–N6) High-powered views of eGFP+/DCX+ cells indicated by arrows in (N). Shown in (P–U) are representative images of eGFP/GFAP, eGFP/MASH1-double positive (B,C) cells in the ipsilateral SVZ. Double positive cells in (Q,S) are indicated by arrows. Scale bar, 50 μm. *p < 0.001, n = 5 mice for each group.

