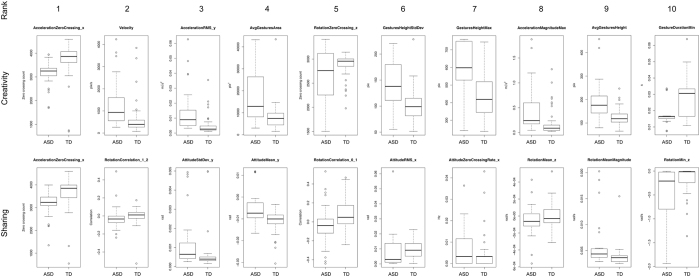
Figure 4. Boxplots of the ten features with the greatest Kolmogorov-Smirnov distance between Autism and Control groups for the Creativity and Sharing games.
Descriptions of these features are given in Table 3. Boxplots show median values (horizontal line), interquartile range (box outline), minimum and maximum values of the upper and lower quartiles (whiskers) and outliers (circles).

