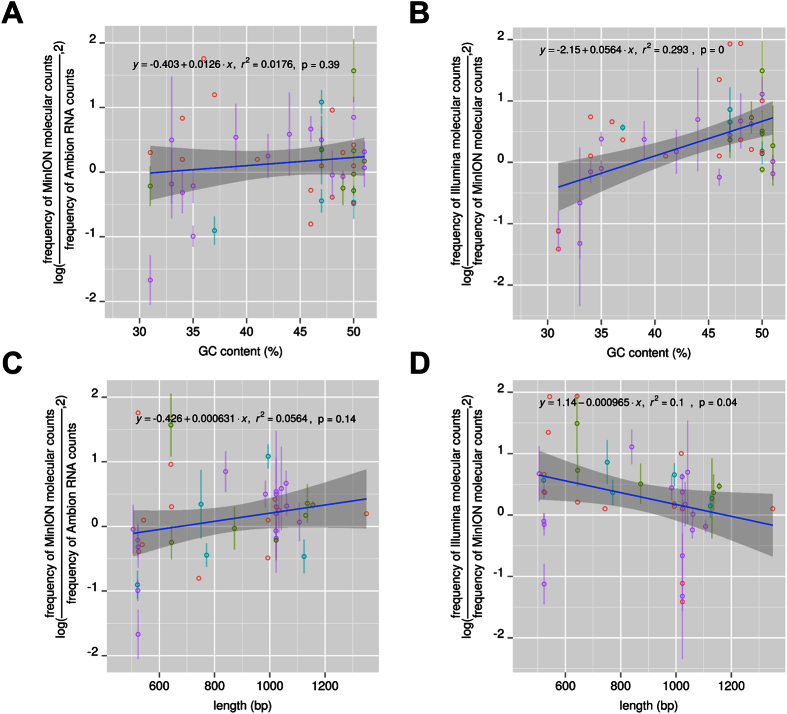
Figure 2. Effect of the GC content and ERCC length on the estimation of the ERCC cDNA abundance with the ONT MinION platform.
The figures present deviations of the ERCC expression level estimates with the ONT MinION platform from the Ambion RNA molecular counts (A,C) or from the Illumina HiSeq 2500/MiSeq estimated cDNA abundance (B,D) as a function of the GC content (A,B) and the ERCC length (C,D). We plot the log2 ratio of observed (ONT MinION) to expected (Ambion, Illumina) read counts for the ERCC spike-ins (y-axis, log) for each of the samples relative to their length or GC content (x-axis). Due to the variable sequencing depth from each ERCC MinION experiment, each point is the average value from different MinION flow cell runs if at least 5 reads have been detected for this point in the corresponding MinION runs. The points are colored differently based on the number of flow cell runs in which they were detected (red, green, cyan, purple correspond to values derived from one, two, three or four flow cell runs respectively). The standard deviation is also presented for points with values from two or more MinION runs.

