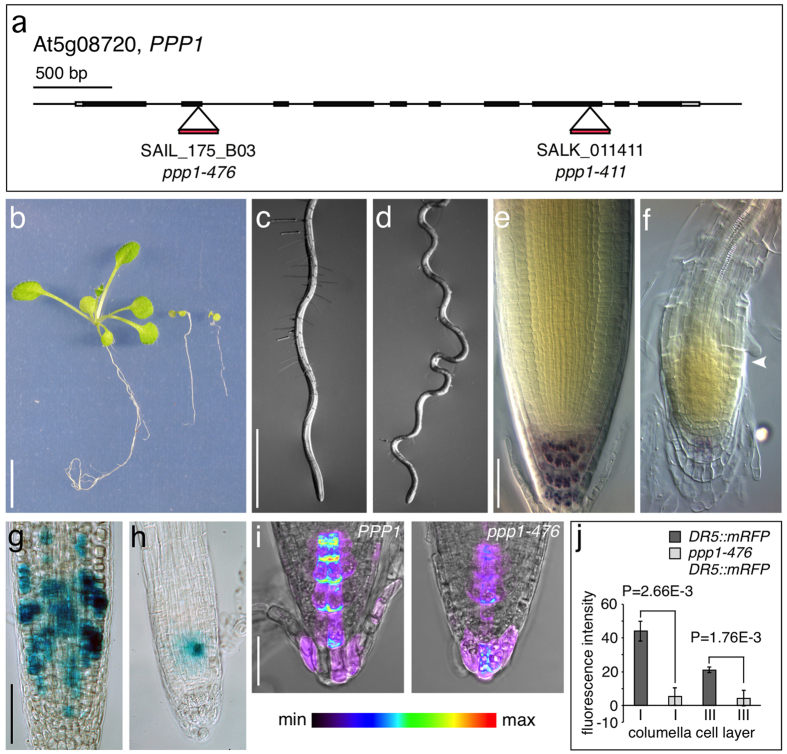
Figure 5. Analysis of ppp1 loss-of-function alleles.
(a) Position of T-DNA insertions in the genomic PPP1 locus. (b) Wild type (left), ppp1-411 (middle) and ppp1-476 (right) plantlets at 16 DAG. (c,d) Primary roots of wild type (c) and ppp1-411 at 10 DAG (d) grown on vertically oriented plates. (e,f) Lugol-staining of wild type (e) and ppp1-411 (f) root meristems at 14 DAG. White arrowhead indicates onset of cell expansion. (g,h) Activity of CYCB1;1::GUS in wild type (g) and ppp1-476 (h) root meristems at 10 DAG. (i) Expression intensities of DR5::mRFP in wild type (i) and ppp1-476 (j) root meristems. (j) Quantification of DR5::mRFP signal intensities in the 1st and 3rd layer of root cap columella cells at 6 DAG (root cap cells from ≥10 seedlings were analyzed for each genotype; statistical analysis was performed using Student’s two-tailed t-test; error bars indicate standard deviations. Bars: b = 10 mm; c,d = 1 mm; e,f = 20 μm; g,h = 50 μm; i = 10 μm.

