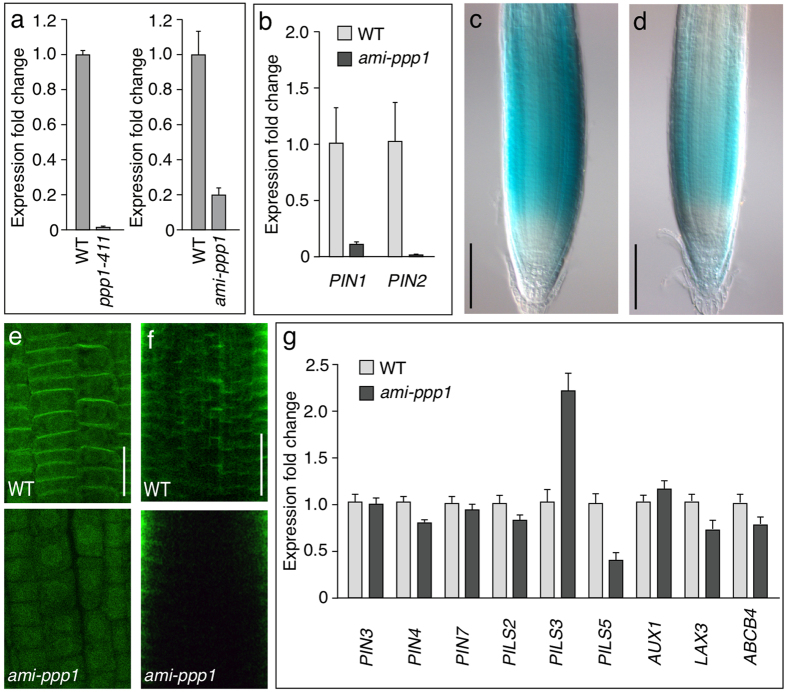
Figure 6. Expression profiling upon loss of PPP1.
(a) qPCR analysis of PPP1 expression in wild type (“WT”) seedlings versus ppp1-411 insertion mutant seedlings (left) and an ami-ppp1 silencer used for further analysis (right; see text). Graphs depict expression fold change in PPP1 expression in ppp1-411 and ami-ppp1 relative to WT and normalized to the expression of 2 reference genes (EIF4a and TUB). Error bars depict s.e.m. from 3 biological replicates. (b) qPCR analysis of PIN1 and PIN2 transcript levels in wild type (WT) seedlings versus ami-ppp1 seedlings. Graph depicts expression fold change in PIN gene expression in the ami-ppp1 line relative to WT and normalized to the expression of 2 reference genes (EIF4a and TUB). Error bars depict s.e.m. from 3 biological replicates. (c,d) Activity of PIN2p::GUS in a wild type (c) and in a ami-ppp1 (d) root meristem. (e,f) Whole mount immuno-labeling performed with wild type (top) and ami-ppp1 (bottom) seedlings at 4 DAG that were probed with anti-PIN2 (e) and anti-PIN1 (f). (g) qPCR analysis of transcript levels of genes involved in intra- and intercellular auxin transport in wild type (WT) and ami-ppp1 seedlings. Graph depicts expression fold change in gene expression in the ami-ppp1 line relative to WT. Error bars depict s.e.m from 3 biological replicates. Bars: c,d = 100 μm; e,f = 20 μm.

