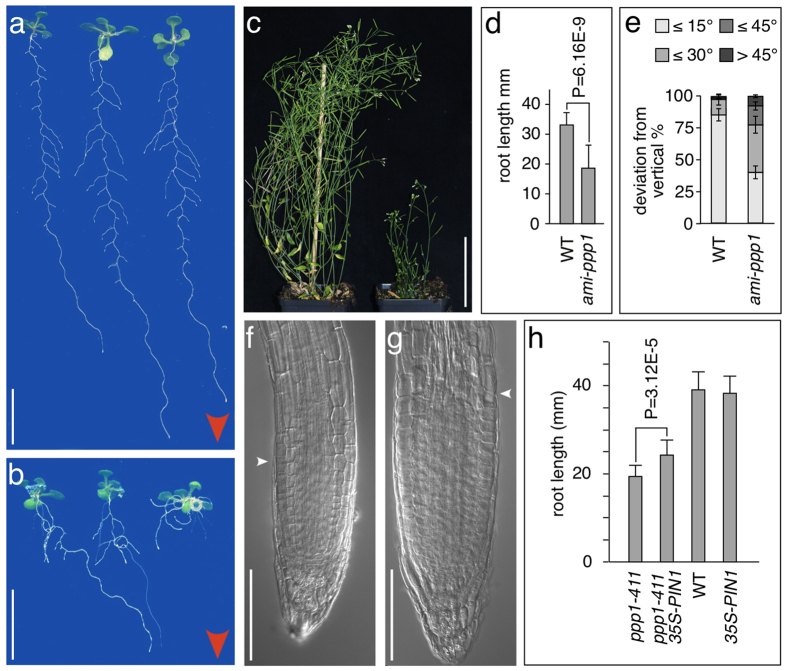
Figure 7. Phenotypic analysis of ppp1 loss-of-function lines.
(a,b) Comparison of wild type (a) and ami-ppp1 (b) plantlets grown on vertically orientated agar plates for 11 days. Red arrowheads indicate direction of gravity vector (c) Wild type (left) and ami-ppp1 (right) plants at 35 days. (d) Primary root length of wild type and ami-ppp1 seedlings at 8 DAG. Error bars represent standard deviations (n = 30 seedlings for each genotype; statistical analysis was performed using Student’s two-tailed t-test). (e) Orientation of primary root growth of wild type and ami-ppp1 seedlings at 8 DAG. A total of 114 (wild type) and 118 (ami-ppp1) seedlings was analyzed in 3 biological repeats, and plotted as percentage of seedlings displaying <15°, <30°, <45° and >45° deviation from the vertical growth axes. Error bars indicate standard deviations. (f,g) Comparison of ppp1-411 (f) and ppp1-411 35S::PIN1 (g) primary root meristems at 9 DAG. White arrowheads depict onset of cell elongation. (h) Partial rescue of ppp1-411 root elongation by 35S::PIN1. Root lengths of wild type (WT), 35S::PIN1, ppp1-411 and ppp1-411/35S::PIN1. The latter is significantly longer compared to ppp1-411 mutants (n ≥ 20 individuals analyzed for each genotype; statistical analysis was performed using Student’s two-tailed t-test; standard deviations are shown as error bars). Bars: a,b = 10 mm; c = 50 mm; f,g = 50 μm.

