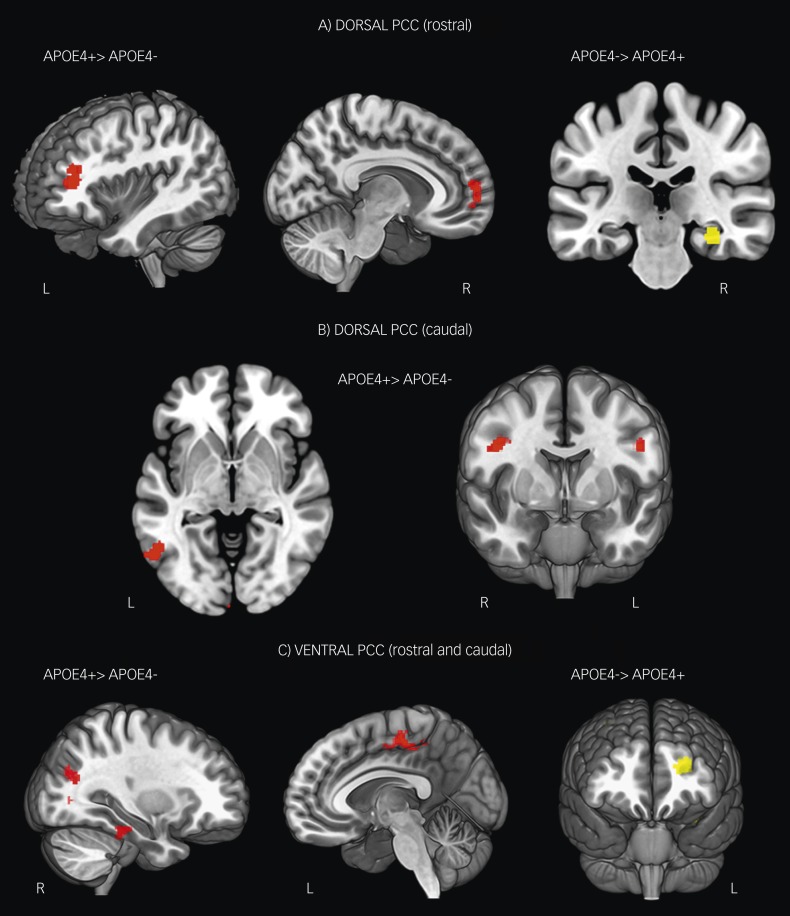
Fig. 2. Z-score maps showing significant between-group differences in functional connectivity of the dorsal (A and B) and ventral (C) posterior cingulate cortex.
Red=areas where connectivity was significantly greater in APOE ε4+ individuals and yellow=areas where connectivity was significantly greater in APOE ε4– individuals. Results are shown at P<0.001, cluster-wise corrected.

