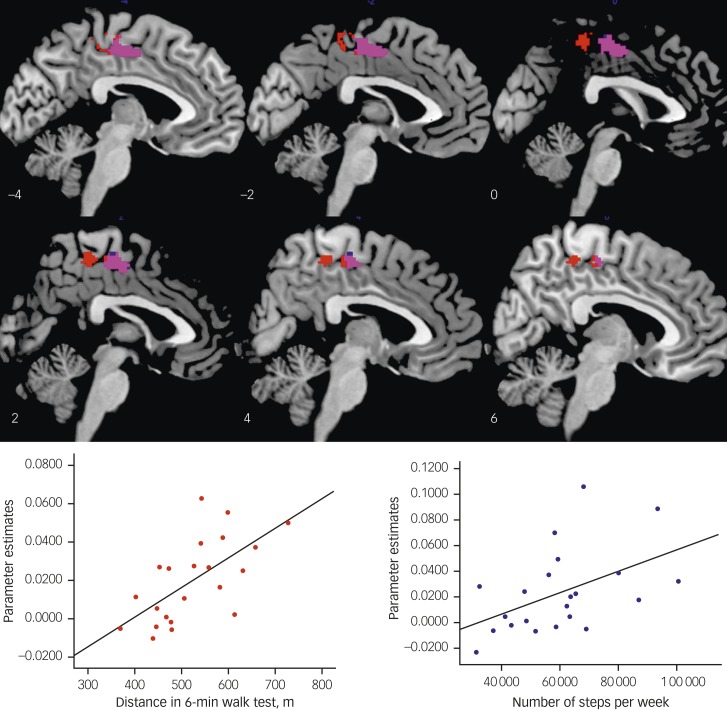
Fig. 3. Relationship between baseline physical activity and ventral (rostral) connectivity in APOE ε4+ individuals.
Sagittal slices showing the region of supplementary motor area (SMA) that correlated with distance travelled in a 6-minute walk test (red) and total number of steps per week (blue). Violet=overlap between the two independent measures. Right (upper): scatterplot showing the significant association between 6-minute walk test scores ventral posterior cingulate cortex (PCC) connectivity strength with the SMA, R=0.71, P=0.001. Right (lower): scatterplot showing the significant association between total number of steps per week and ventral PCC connectivity strength with the SMA, R=0.64, P=0.001.

