
Figure 2. Results of geNormPlus and NormFinder.
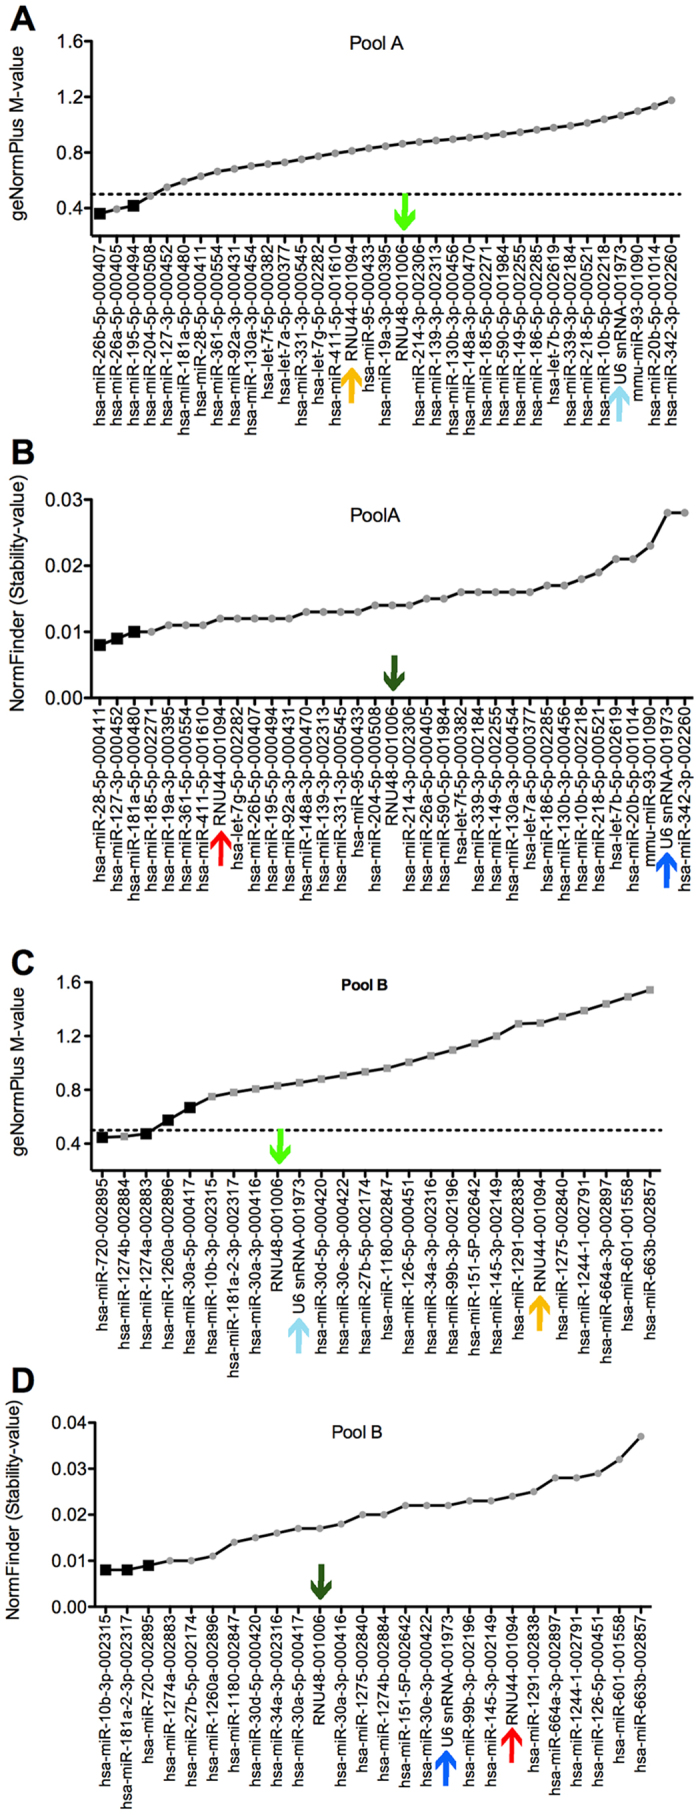
geNormPlus analysis shows the calculation of the average expression stability M-value of all candidate reference genes determined by RT-qPCR (A,C). Genes with the highest M-value have the least stable expression, while the genes with the lowest M-value have the most stable expression. The x-axis presents the ranking of reference genes in order of decreasing stability from left to the right. High stability is defined by an M-value of <0.5 as indicated by the dotted line. Chosen reference miRNAs are highlighted by black squares. By analogy NormFinder Stability-values are listed in an ascending order (B,D). Small-nucleolar RNAs (snoRNAs such as RNU48, RNU44 and U6snRNA) are indicated by coloured arrows. snoRNAs are indicated by coloured arrows.