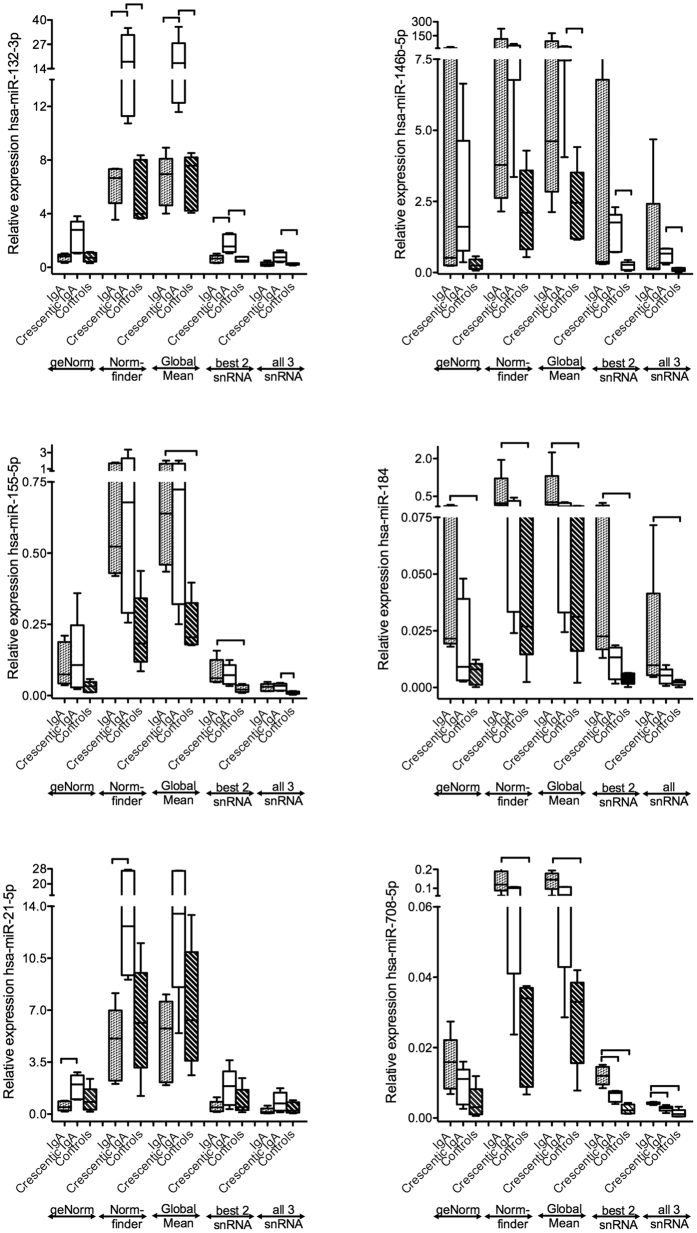
Figure 6. Effects of different normalization approaches on the expression of miRNAs in IgA-GN.
Quantitative differences of six significantly different expressed miRNAs are shown in dependence from different normalization factors. Relative expression levels were calculated using the following normalization methods: geNormPlus (miR-26b, miR-195-5p) NormFinder (miR-28-5p, miR-127-3p, miR-181a-5p), global Mean, best two snRNAs (RNU44, RNU48) and all 3 snRNAs (RNU44, RNU48, snRNU6). Four miRNAs (miR-132-3p, miR-146-5p, miR-184, miR-708-5p) demonstrated high consistency throughout different normalization methods. Significant differences are illustrated by horizontal lines as P values < 0.05 of the nonparametric pairwise ranking test (Steel-Dwass test for multiple comparison analysis). Median values, 25/75 percentiles (grey dotted boxes, IgA-GN; white, crescentic IgA-GN; striped, controls) as well as 10/90 percentiles (whiskers) are shown.

