
Fig. 4. Chemical screen of the transformed NPCs.
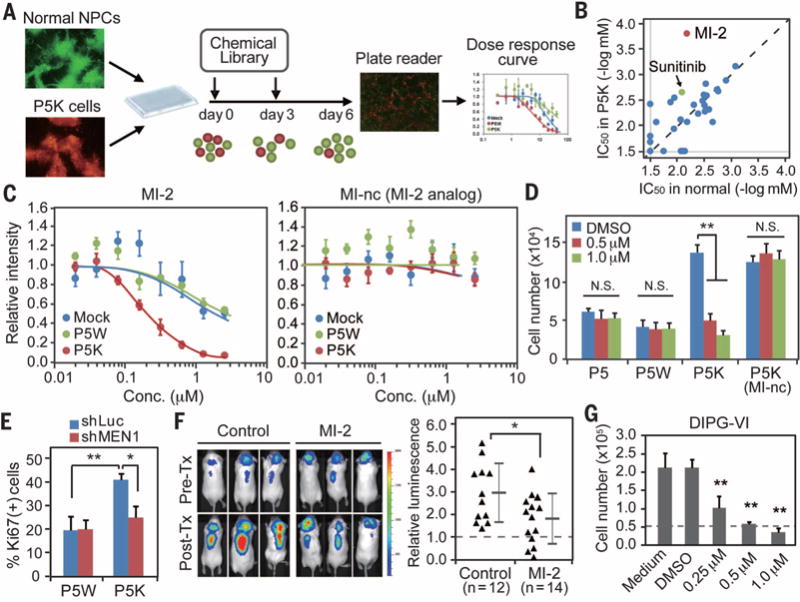
(A) Schematic representation of the screening strategy. A mixture of GFP-labeled normal NPCs and RFP-labeled P5K cells in a 1:3 ratio were plated into 96-well plates, and each compound in the library was added in a twofold serial dilution for a total of eight doses. (B) IC50 was calculated for each compound after 6 days in vitro by using a fluorescence plate reader. (C) Representative dose-response curves in normal NPCs (mock, blue), P5W (green), and P5K (red) cells treated with MI-2 or MI-nc (MI-2 analog) show selectivity of MI-2, a menin inhibitor (n = 4). (D) Viability assay demonstrates a significant effect of MI-2 on P5K cells, with no impact on normal or P5Wcells (n = 4). (E) Silencing of menin via shRNA also decreased the proliferation of P5K cells. (F) Administration of MI-2 suppressed in vivo growth of P5K cells. Intracranial growth of luciferase-labeled P5K cells was measured by quantitative in vivo bioluminescence imaging. Values indicate fold change of luminescence before and after the treatment. (G) MI-2 treatment suppressed the proliferation of a patient DIPG-derived cell line. Cells were treated with MI-2 for 7 days, and the number of viable cells was counted by trypan blue staining (n = 4). Error bars in panels (C) to (G) indicate means ± SD. *P < 0.05; **P < 0.01; NS, not significant.