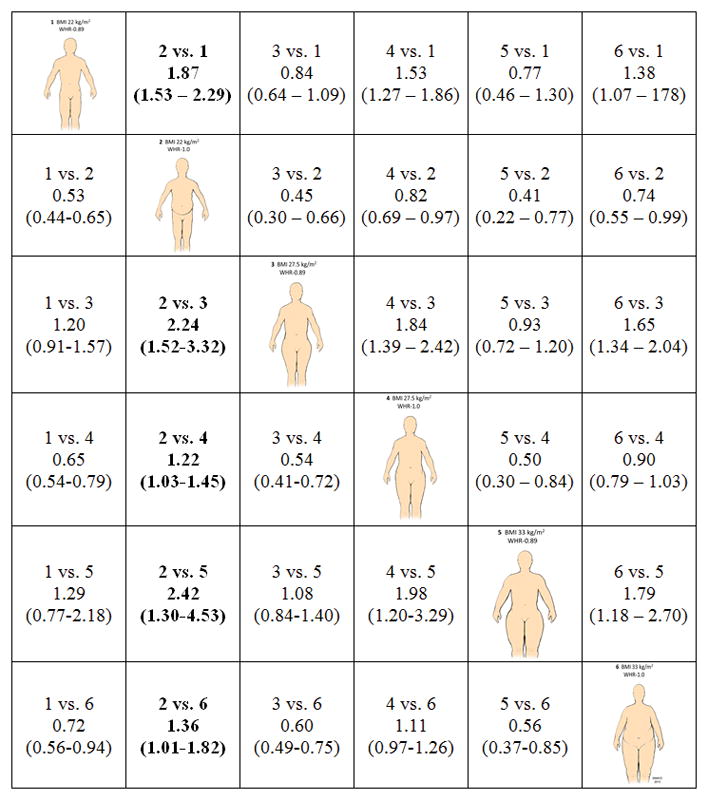
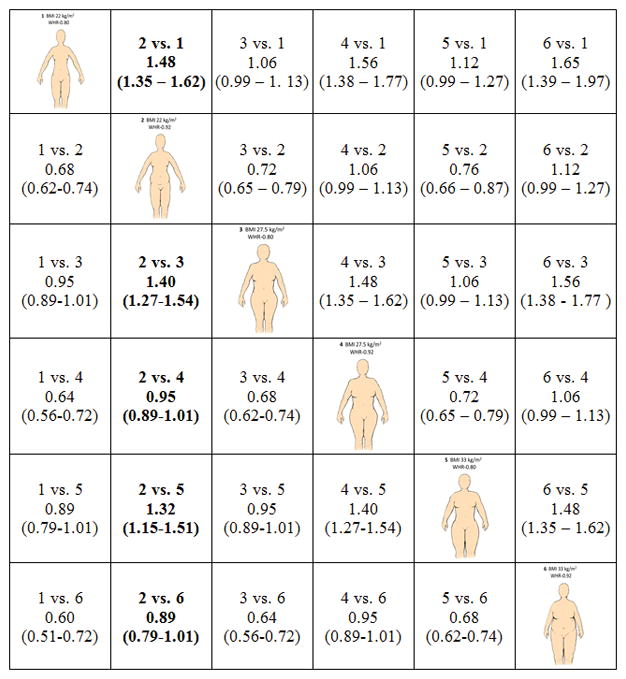
Figure 1.


Hazard ratios and 95% CIs for all-cause mortality for men (Figure 1a) and women (Figure 1b) as estimated by statistical models presented in Supplemental Tables 1 and 2. To interpret the hazard ratios, select an intersection of two anthropometric profiles of interest. The group of interest (i) relative to the referent (j) is indicated as entries “i vs. j” in the table cells. For example, to compare a normal weight but centrally obese male (profile 2; BMI = 22, WHR = 1.0) relative to an overweight but not centrally obese person (profile 4; BMI =27.5, WHR = 1.0), the cell in row 4, column 2 would be referenced (Denoted 2 vs. 4 with HR = 1.22 and 95% CI: 1.03 to 1.45).
