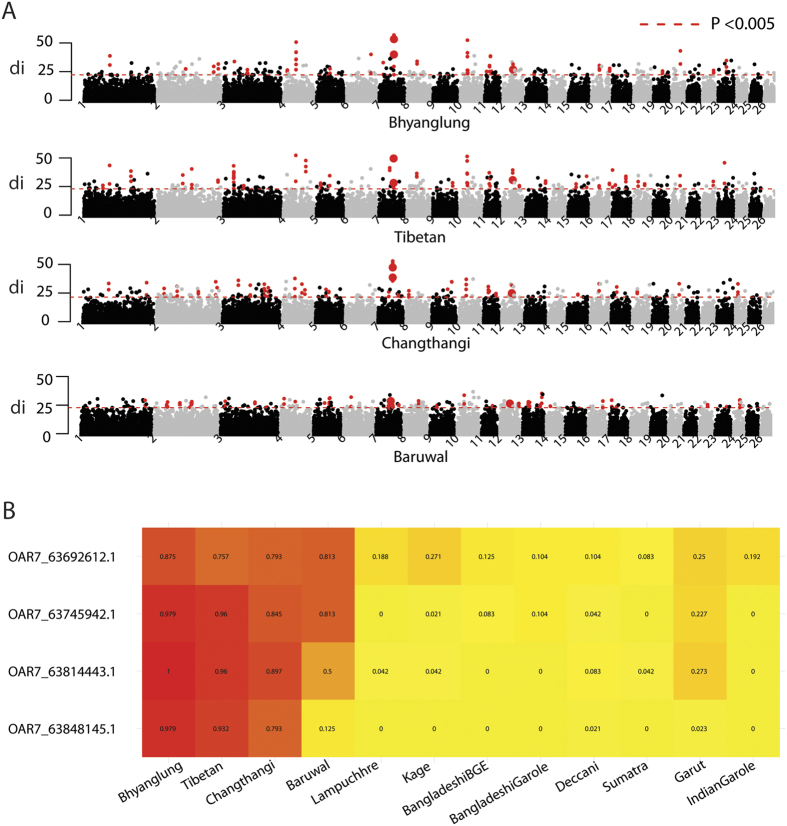
Figure 3. Identification of directional selection for high-altitude adaptation.
(A) Manhattan plot of genome-wide distribution of di values for each of the four high-altitude sheep breeds. Red dots represent significant SNPs within merged regions. The larger red dots indicate common significant SNPs shared by the four breeds, and the threshold indicating signature of selection is denoted with a dashed red line. (B) A heat map of frequencies of major allele in high-altitude sheep of the top SNP loci for each tested populations.

