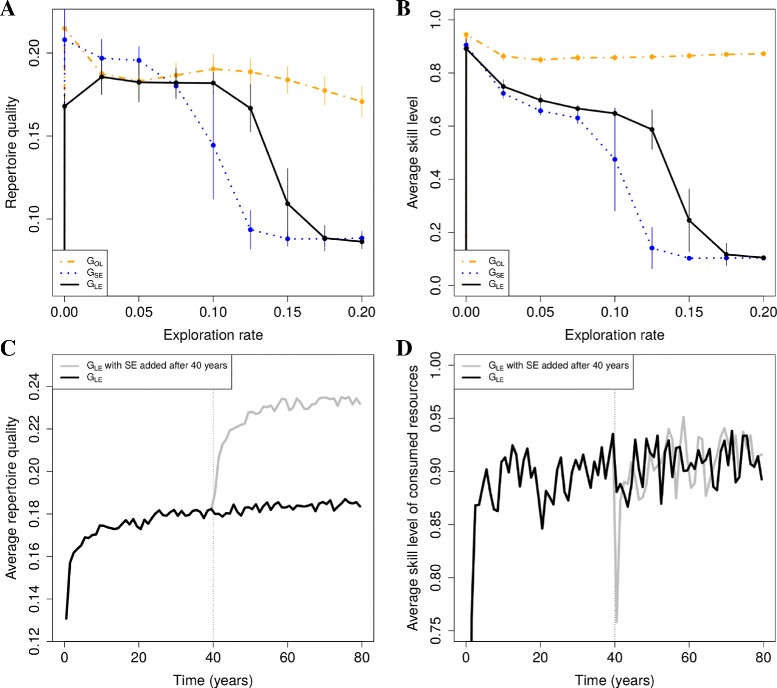
Fig. 4.

Effect of SE and OL. Top: average repertoire quality (a) and average skill level of consumed resources (b) as a function of exploration rate. Shown are means and standard deviation using data from years 40 to 140 from 10 simulations. Simulations as in Fig. 3C (group-level variation). Bottom: ‘switch’ simulations showing the immediate and long term effects of SE on repertoire quality (c) and average skill levels (d)
