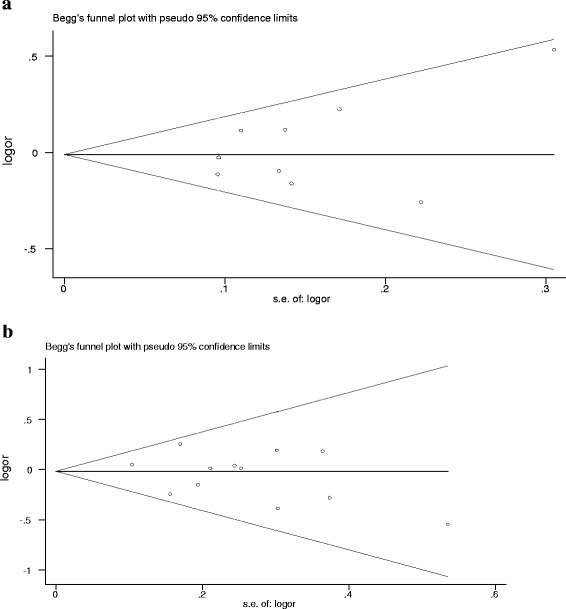
Fig. 3.

Funnel plot analysis for detection of publication bias. Each point represents a separate study for the indicated association. a Funnel plot: dominant model AA + GA vs. GG of VDR Cdx2 polymorphism in overall analysis (P = 0.67) and (b) Funnel plot: dominant model AA + Aa vs. aa of VDR ApaI polymorphism in overall analysis (P = 0.48)
