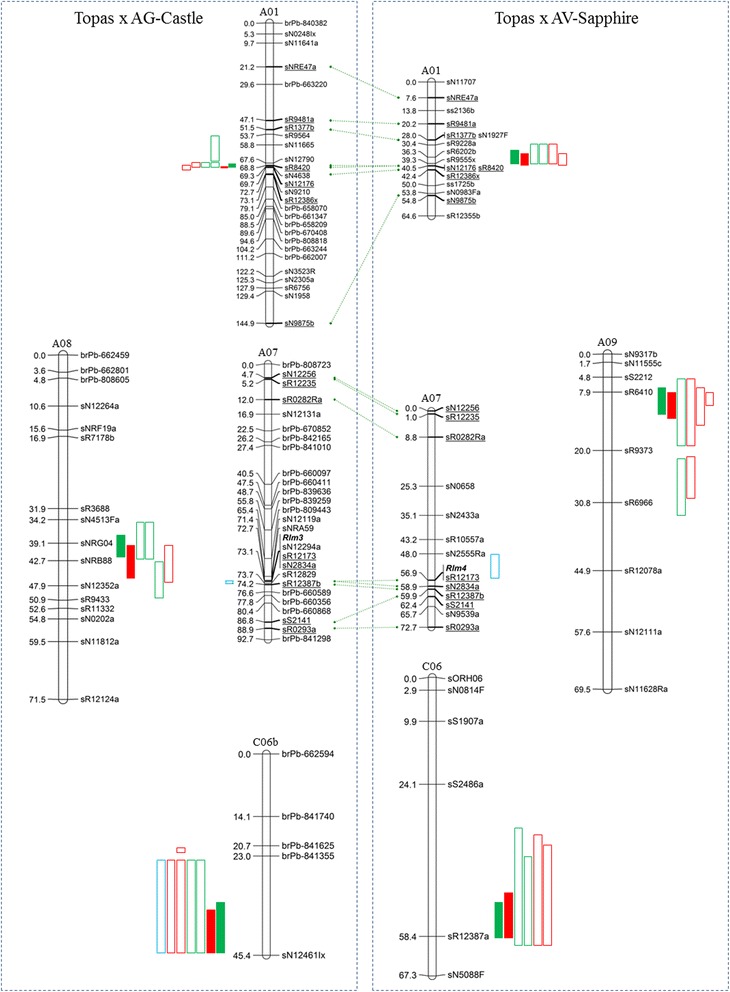
Fig. 2.

Significant QTL clusters for TC and TS Populations. Linkage maps shown only for B. napus chromosomes harbouring significant QTL (TC: A01, A07, A08 & C06; TS: A01, A07, A09, C06). QTL for survival (green), internal infection (red) and cotyledon (blue) metrics. Single-environment QTL shown as open boxes, multi-environment QTL as solid boxes. Green dotted lines indicate common markers. Positions of blackleg R genes Rlm3 and Rlm4 shown in bold
