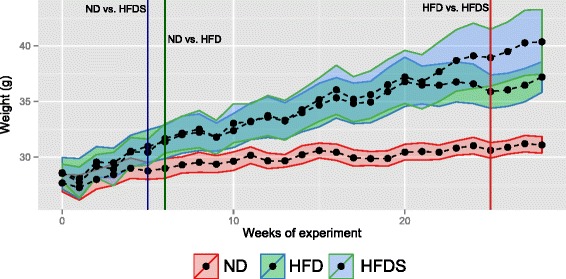
Fig. 1.

Mean body weights and 95 % confidence intervals of mice in each treatment group throughout the 28 weeks of the experiment. Vertical lines indicate time thresholds from which statistically significant differentiation between groups occurred. ND - normal diet; HFD - high fat diet; HFDS - HFD-fed mice supplemented with feces
