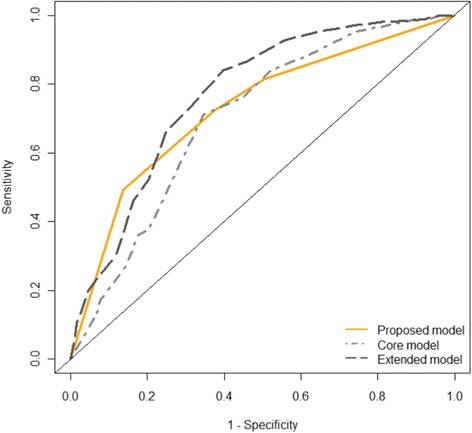
Fig. 3.

ROC curves comparing the performance in the validation set of the proposed model with two previously validated models. Sensitivity is the proportion of those with an acceptable outcome who were correctly predicted to have an acceptable outcome. Specificity is the proportion of those with a poor outcome who were correctly predicted to have a poor outcome
