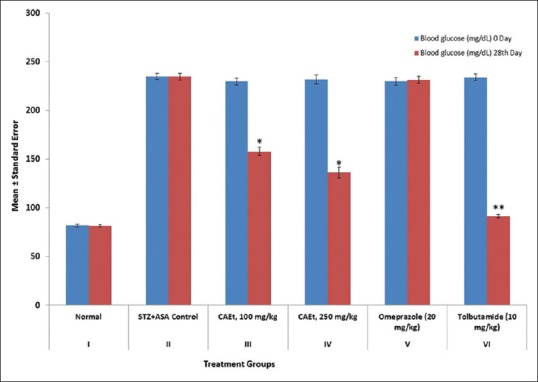
Figure 2.

Effect of C. attenuata Extract on Blood Glucose Tolerance in Diabetic Ulcer Rats. The values represent the mean ± SEM for six rats per group. Values are expressed as mean ± SEM of six rats in each group. *P < 0.01 and **P < 0.001 compared with control group
