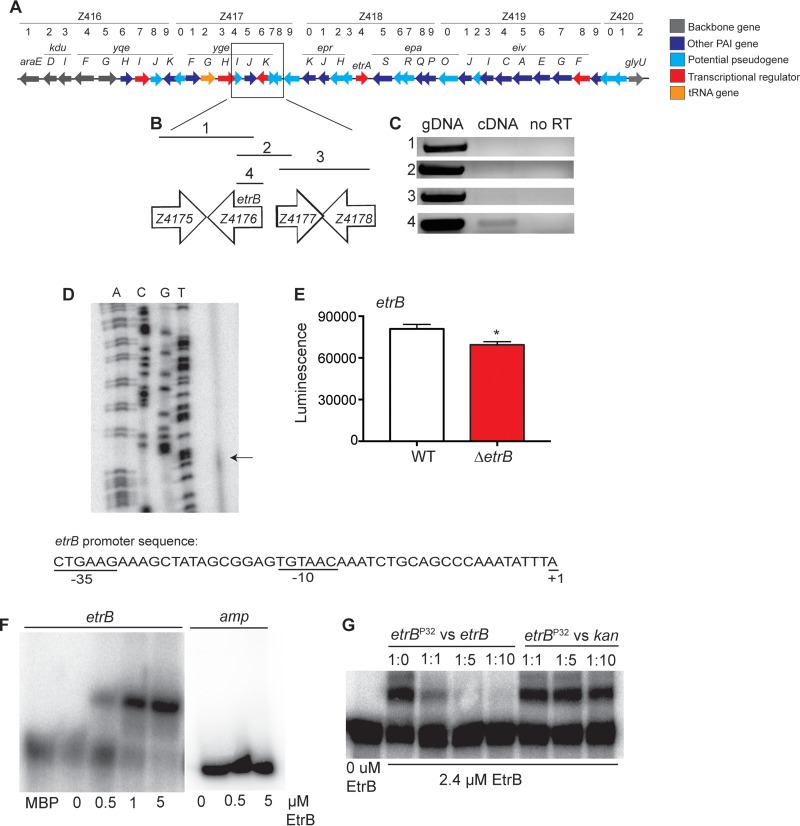
FIG 1.
etrB expression and autoregulation. (A) Schematic representation of the ETT2 genetic locus in EHEC. PAI, pathogenicity island. (B) Inset of etrB and adjacent genes. Lines with numbers indicate regions amplified and correspond to PCRs shown in panel C. (C) RT-PCR of etrB and adjacent genes. Genomic DNA (gDNA) was used as a positive control, and a reaction without RT was used as a negative control. (D) Primer extension assay of etrB. The first four lanes show the etrB sequencing ladder. The arrow represents the transcription start site of etrB. The promoter sequence of etrB is shown with the predicted transcription start site and −10 and −35 regions. (E) Expression of etrB in WT 86-24 or the ΔetrB strain transformed with the etrB::lux reporter (n = 3; error bars represent the geometric means ± standard deviations). *, P ≤ 0.05. (F) EMSA of the etrB promoter and amp negative-control promoter region with MBP or EtrB::MBP. (G) Competition assays with EtrB. The assay was performed with increasing amounts of the unlabeled etrB probe or the unlabeled kan probe as a negative control.

