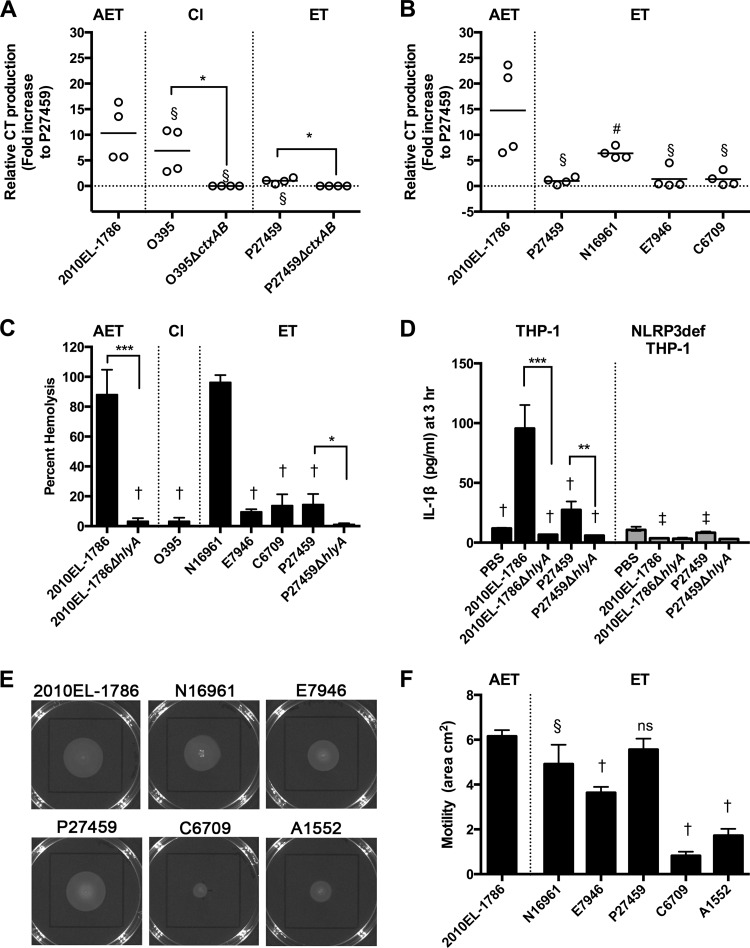
FIG 1.
Toxin production and motility by a variety of V. cholerae isolates. (A and B) Cholera toxin production in AKI+NaHCO3 medium determined by ELISA. Individual data points for two assays performed in duplicate are shown to demonstrate range. To account for differences in raw values across two assays, merged data were normalized to the mean CT production (nanograms per milliliter per OD unit) observed for P27459, the lowest value in each assay. Lines indicate the means. (C) Hemolysis of sheep RBCs normalized to 100% lysis by 1% Triton X-100. (D) Secretion of IL-1β to medium from THP-1 monocytic-like cells or NLRP3-deficient THP-1 cells. Hemolysis and IL-1β assay results are shown as means ± standard deviations (SDs) of merged data from biological triplicates for at least two independent experiments. (E and F) Soft-agar motility of V. cholerae inoculated in the center of the plate and (E) photographed or (F) quantified as area using the Caliper Lumina LTE IVIS imager, shown as means ± SDs from biological triplicates. Symbols represent statistically significant difference by one-way analysis of variance (ANOVA) followed by Dunnett's multiple-comparison test compared to 2010EL-1786 in the same panel (#, P < 0.05; §, P < 0.01; †, P < 0.001) or the same sample between THP-1 or NLRP3-deficient THP-1 panels (‡, P < 0.001). Asterisks indicate statistically significant difference of indicated samples by Student's two-tailed t test (*, P < 0.05; **, P < 0.01; ***, P < 0.001). ns, not significant.

