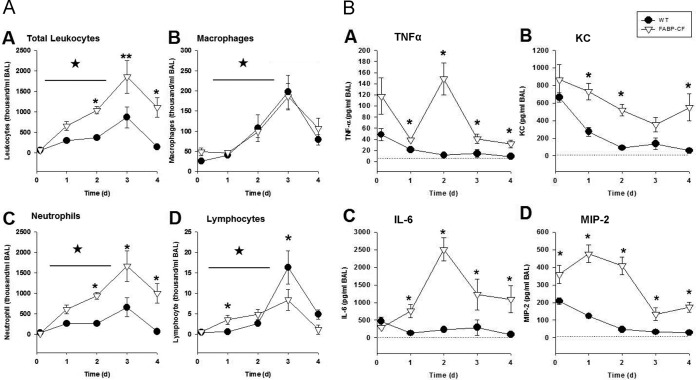
FIG 2.
(A) BAL fluid cell counts and differentials were obtained from CF and WT mice after intratracheal inoculation with P. aeruginosa agar beads at 3 h and days 1 through 4. Values represent the means ± SEMs of the total and absolute cell counts. (A.A) The CF mice had elevated leukocyte counts at all time points relative to WT animals (*, P ≤ 0.05), and both groups of animals had elevated leukocyte counts relative to uninfected controls (*, P ≤ 0.05). (A.B) Both CF and WT animals had similar macrophage numbers, with the difference from the numbers at the baseline reaching significance by day 2 (*, P ≤ 0.05) and the difference being sustained to day 4 (*, P ≤ 0.05). (A.C) Neutrophil counts were increased in the CF mice relative to those at the baseline (*, P ≤ 0.05) and in the WT controls (*, P ≤ 0.05) at the same time points. (A.D) Lymphocyte counts were elevated in CF mice on day 1 (*, P ≤ 0.05) and day 2 (*, P = 0.08), but by day 3, WT mice had more lymphocytes (*, P ≤ 0.05), and this was sustained to day 4 (*, P ≤ 0.05). (B) Cytokines (IL-6, TNF-α, KC, MIP-2) were obtained from the BAL fluid of CF mice and WT mice after intratracheal inoculation with P. aeruginosa agar beads at 3 h and days 1 through 4. Values represent the mean ± SEM concentrations of TNF-α (B.A), KC (B.B), IL-6 (B.C), and MIP-2 (B.D). IL-6 and TNF-α levels were significantly higher in CF mice than in WT mice on days 1 through 4 (*, P ≤ 0.05). The KC level was significantly higher in CF mice than in WT mice on days 1, 2, and 4 (*, P ≤ 0.05). The MIP-2 level was significantly higher in the CF mice than in WT mice at all time points (*, P ≤ 0.05).

