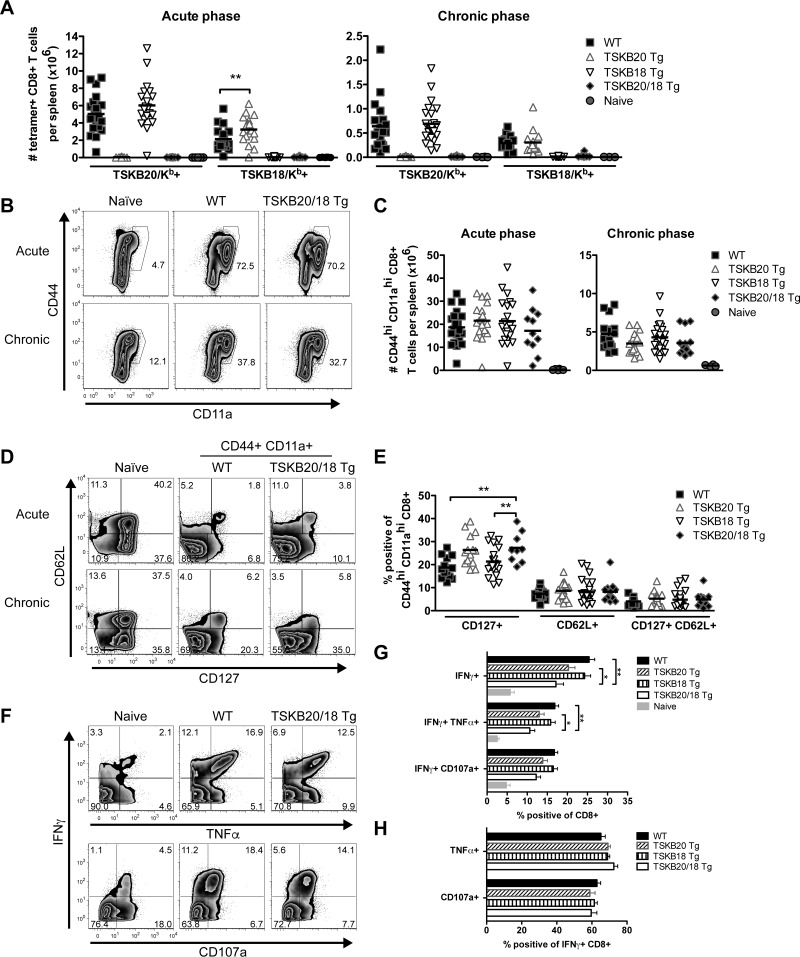
FIG 4.
Effector CD8+ T cell populations expand and exhibit an effector-memory phenotype in the absence of TSKB20 and TSKB18 immunodominance. (A) The total number of TSKB20/Kb+ or TSKB18/Kb+ CD8+ T cells per spleen of naive or T. cruzi-infected WT, TSKB20 Tg, TSKB18 Tg, or TSKB20/18 Tg mice at 18 to 21 days postinfection (left) or 238 to 337 days postinfection (right). (B) Representative staining for CD44 and CD11a expression during acute (day 18) and chronic (day 238) phases of infection. Histograms are gated on CD8+ CD4− events, and numbers represent percentages of gated events. (C) The total number of CD44hi CD11ahi CD8+ T cells per spleen of age-matched naive or T. cruzi-infected WT, TSKB20 Tg, TSKB18 Tg, or TSKB20/18 Tg mice. (D) Representative staining for CD127 and CD62L expression during acute (day 18) and chronic (day 238) phases of infection. Histograms are gated on CD8+ CD4− for age-matched naive mice and further gated on CD44hi CD11ahi antigen-experienced cells for infected WT and TSKB20/18 Tg mice. (E) Proportion of CD44hi CD11ahi-gated CD8+ splenocytes that expressed the indicated marker during the chronic phase (238 to 337 days postinfection). Data points in panels A, C, and E are individual mice (squares are WT, up triangles are TSKB20 Tg, down triangles are TSKB18 Tg, diamonds are TSKB20/18 Tg, and circles are uninfected naive mice), and bars are means from 4 cumulative experiments in the acute phase (n = 11 to 21 per infected group) and 5 cumulative experiments in the chronic phase (n = 14 to 23 per infected group). (F) Representative intracellular staining of IFN-γ and TNF-α (top) or surface accumulation of CD107a (bottom) after 5 h of stimulation with plate bound anti-CD3. Histograms are gated on CD8+ CD4− events, and numbers indicate the proportions of events within the gated quadrant. Data are from 338 days postinfection. (G) Cumulative data presented in panel F. Data are from 4 cumulative experiments in the chronic phase (238 to 337 days postinfection) (n = 14 to 24 per infected group). (H) Data are from 3 cumulative experiments in the chronic phase (238 to 337 days postinfection) (n = 11 to 17 per infected group). Filled black bars are WT, forward-slashed bars are TSKB20 Tg, vertical-slashed bars are TSKB18 Tg, open bars are TSKB20/18 Tg, and filled gray bars are uninfected naive mice). Data are means + standard errors of the means (SEM). *, P < 0.05; **, P < 0.01.

