
FIG 7.
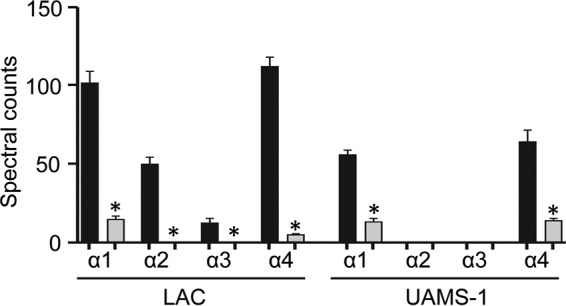
αPSM levels assessed by GeLC-MS/MS. Black bars, amounts of the indicated PSMs produced by LAC or UAMS-1; gray bars, amounts of the indicated PSMs produced by the isogenic sarA mutants. *, statistically significant difference for the indicated peptide compared to the amount of the same peptide observed in the isogenic parent strain.