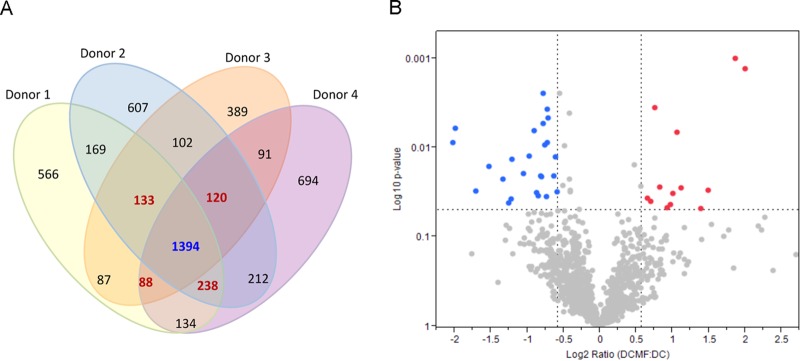
FIG 1.
Proteomic analyses of unexposed and mf-exposed human DC. Human DC, unexposed or mf exposed for 48 h, were harvested, lysed, processed, and analyzed by LC-MS/MS. (A) Venn diagram representing the number of proteins identified in human DC (unexposed or mf exposed) from 4 healthy donors. A total of 1,394 proteins (marked in blue) were identified in all four donors in both DC and mf-exposed DC. (B) Volcano plot of significantly regulated proteins by mf in human DC (>1.5-fold) with log10 values (P values) on the x axis and log2 ratios (fold change) on the y axis. Significantly upregulated proteins are shown in red, and significantly downregulated proteins are shown in blue. The P values were calculated using the normalized spectral abundance factors (NSAF) for each protein. See also Fig. S1 and Table S1 in the supplemental material.

