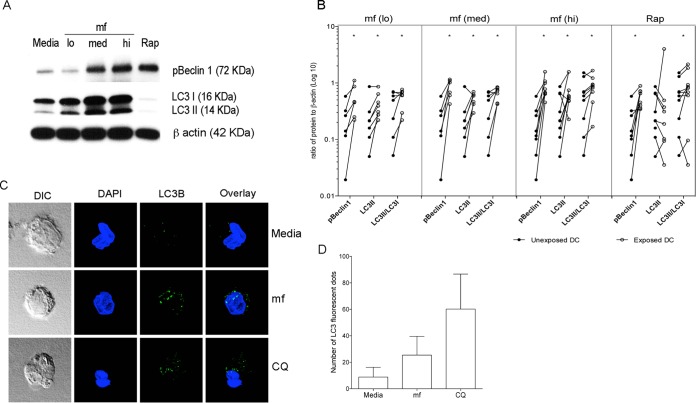
FIG 5.
mf induce phosphorylation of Beclin 1 and conversion of LC3II in human DC. DC left unexposed (medium alone) or exposed to mf at different concentrations (5,000 mf/1 × 106 [lo], 25,000 mf/1 × 106 [med], or 50,000 mf/1 × 106 [hi]) or rapamycin (Rap) for 24 h were harvested and lysed. (A) One representative image of phospho-Beclin 1, LC3I, and LC3II expression using Western blot analysis is shown. (B) Line graphs represent the ratio of intensity of protein to β-actin in each independent donor in either unexposed DC (closed circles) or exposed DC (open circles). *, P ≤ 0.05; **, P ≤ 0.001. (C) DC unexposed (medium alone) or exposed to mf or chloroquine (CQ) for 24 h were harvested and stained with anti-LC3B rabbit polyclonal antibody (LC3II). DIC (differential interference contrast) and fluorescent images of DC stained with LC3 (green) and nucleus (blue). The mf-exposed DC show increased LC3II granules compared with the unexposed DC. (D) Cumulative average fluorescent clusters (0.3-μm size), measured in unexposed DC and in DC exposed to mf or CQ from at least 5 to 10 cells, were averaged and plotted. Error bars represent standard deviations (SD) from 5 to 10 cells. DC geometric mean (GM), 6.7; DC/CQ GM, 54.6; DC/mf GM, 22.1.

