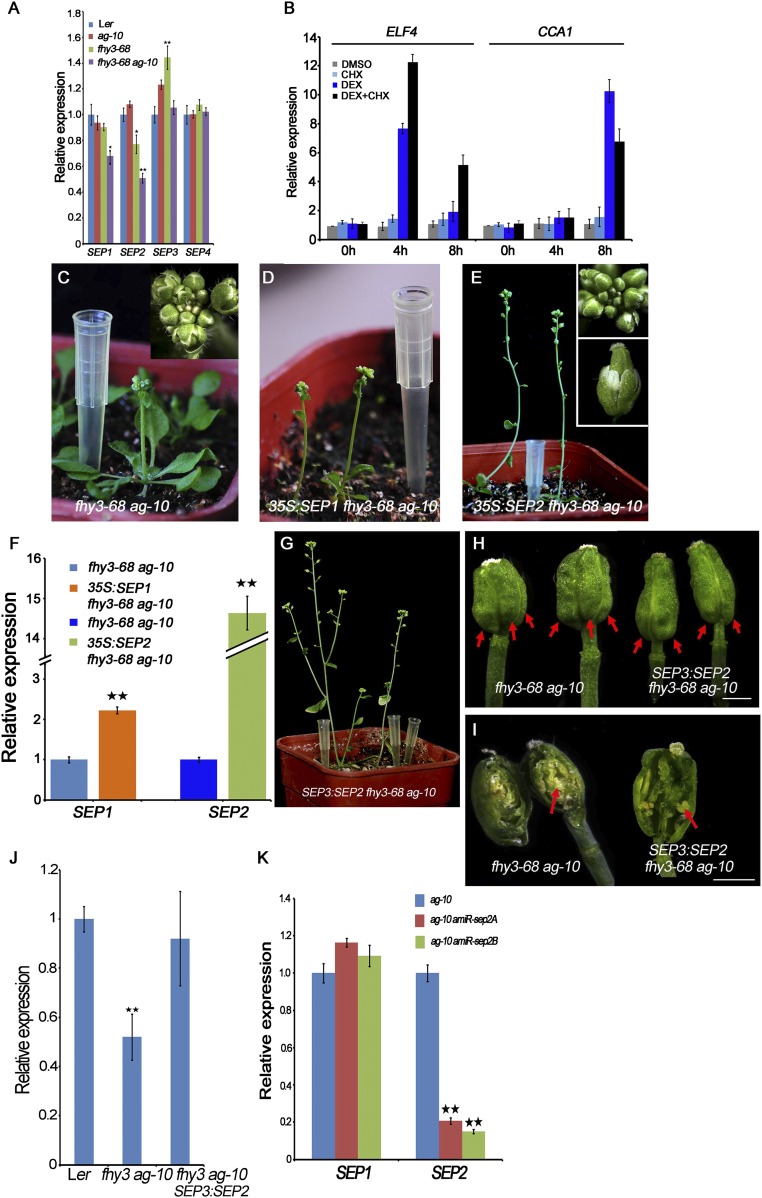
Fig. S4.
SEP2 mediates the function of FHY3 in FM determinacy. (A) The transcript levels of SEPs in the indicated plants measured by RT-PCR. Inflorescences containing stage 8 and younger flowers were used. (B) The transcript levels of ELF4 and CCA1 in FHY3:FHY3-GR fhy3-4 inflorescences measured by RT-qPCR served as a positive control of Fig. 3C. (C–E) Plants and inflorescences (Inset) of fhy3-68 ag-10 (C), 35S:SEP1 fhy3-68 ag-10 (D), and 35S:SEP2 fhy3-68 ag-10 (E). (F) The SEP1 and SEP2 transcript levels in transgenic plants measured by real-time RT-PCR. (G) Plant of SEP3:SEP2 fhy3-68 ag-10 transgenic plant. The plant developed normally at the vegetative stage. SEP3:SEP2 transgene mainly rescued the FM determinacy defects of fhy3-68 ag-10. However, the smaller inflorescence, shorter petal and sterile anther phenotypes were not rescued. (H) Siliques from plants of the indicated genotypes. The siliques of SEP3:SEP2 fhy3-68 ag-10 were composed of two carpels and were thinner than those of fhy3-68 ag-10. Carpels were indicated by red arrows. (I) Representative sliced-open siliques of indicated plants. Removing the primary carpels from fhy3-68 ag-10 siliques revealed additional floral organs growing inside (red arrow). No more layered carpeliod organs except of stamenoid organs (red arrow) grew inside of the silique of SEP3:SEP2 fhy3-68 ag-10 as in fhy3-68 ag-10, indicating that SEP3:SEP2 transgene mainly rescued the FM indeterminacy of fhy3-68 ag-10. (J) The transcript levels of SEP2 in indicated plants measured by real-time RT-PCR. (K) The transcript levels of SEP1 and SEP2 in amiR-sep2 transgenic plants measured by real-time RT_PCR. In A, B, F, G, and K UBQ5 served as the internal control. Three biological replicates were performed. Error bars represent SD from three biological repeats. *P < 0.05 and **P < 0.01. (Scale bars in H and I, 1 mm.)

