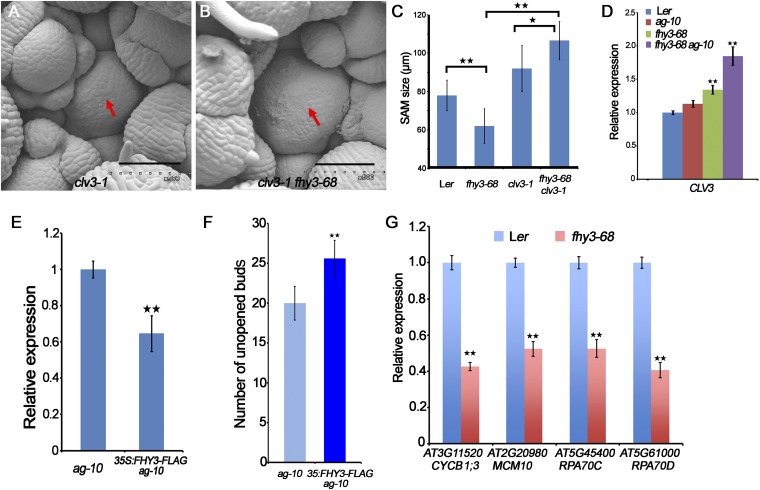
Fig. S5.
Genetic and expression analysis of CLV3 and FHY3. (A and B) SAM (marked by a red arrow) of clv3-1 (A) and fhy3-68 clv3-1 (B). (Scale bars, 60 µm.) (C) SAM size of the indicated plants. The inflorescences of 21-d-old plants were measured for Ler (n = 20), fhy3-68 (n = 20), clv3-1 (n = 20), and fhy3-68 ag-10 (n = 12). *P < 0.5 and **P < 0.01. (D) The CLV3 expression in the indicated plants measured by real-time RT-PCR. (E) The CLV3 transcript level examined by RT-qPCR. (F) Number of unopened buds of the indicated plant inflorescences (n = 22). **P < 0.01. (G) Gene expression of cell cycle gene (CYCB1;3) and DNA replication genes (MCM10, RPA70C, and RPA70D) in Ler and fhy3-68. In D, E, and G UBQ5 served as the internal control. Three biological replicates were performed. Error bars represent SD from three biological repeats. **P < 0.01.

