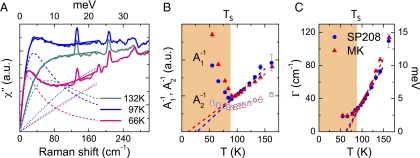
Fig. 5.
(A) Low energy fits of the response of SP208 using a damped Lorentzian for the QEP and an odd in frequency third-order polynomial for the low energy part of the broad peak (Supporting Information). (B) Temperature dependence of the inverse of the two contributions to the nematic susceptibility, and for SP208 (blue dots) and MK (red triangle). The dashed line is a linear fit of between and 150 K. (C) Temperature dependence of the QEP line width . The dashed line is a linear fit between and 150 K.

