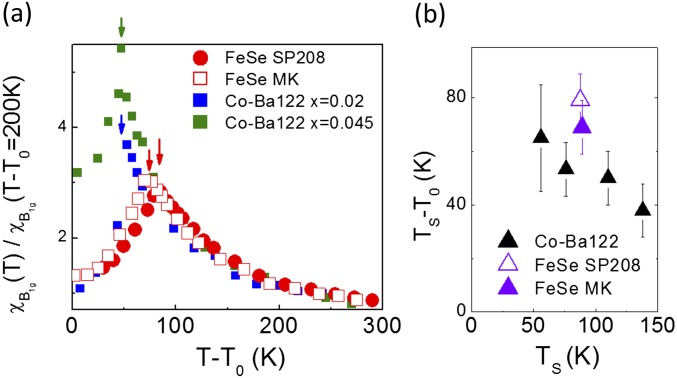
Fig. S4.
(A) Comparison between the charge nematic susceptibility of FeSe and Co doped BaFe2 As2 (23) plotted as a function of T– where is the Curie–Weiss temperature of each sample. The arrows indicate the structural transition for each sample. (B) Electron–lattice coupling energy – as a function of for FeSe and Co-Ba122.

