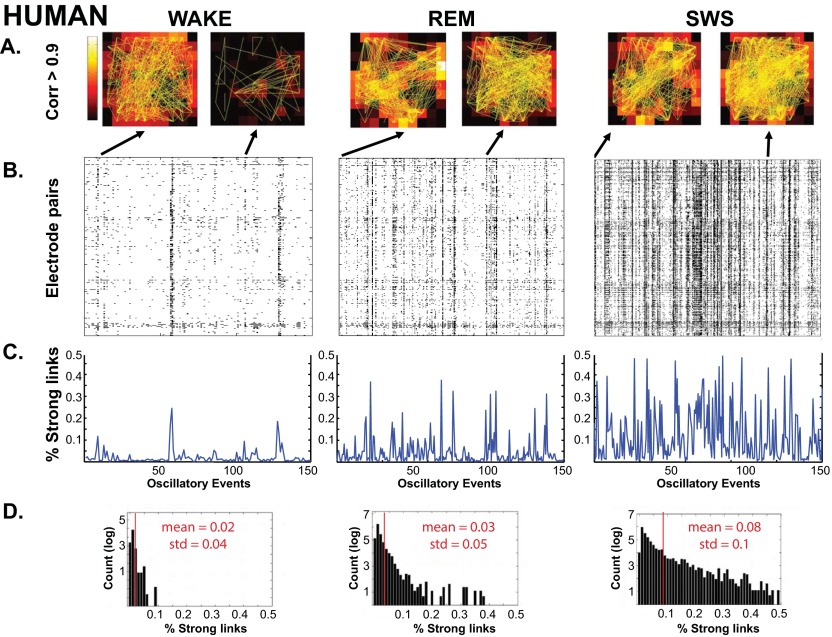
Fig. S5.
(A) Patterns of strong links (maximum cross-correlation ≥ 0.9 over a delay of ±50 ms) occurring across the grid (human). (B) Patterns of pair-wise LFP spatial correlation for different states. Arrows point to the corresponding spatial profile of strong links at sample times. (C) Size distributions of the coherent patterns. In all states, widespread strong correlation across the grid can be seen, but they are less frequent during the WAKE state and very frequent during SWS. C and D show the percentage and statistical distribution of strong links.

