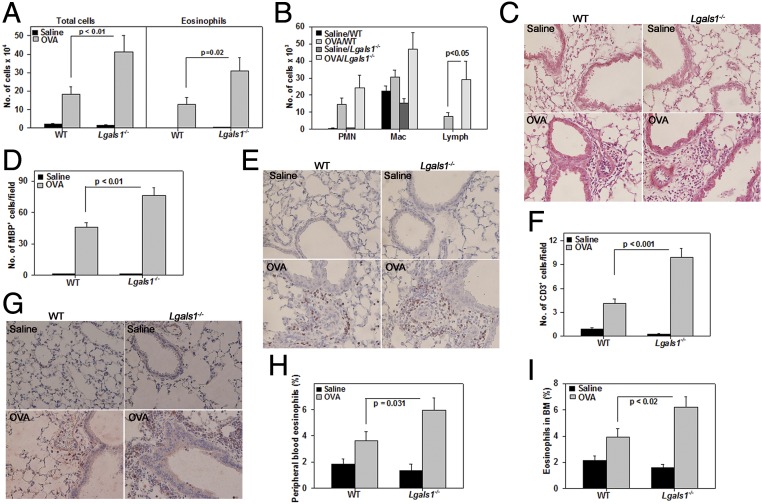
Fig. 7.
Gal-1 deficiency leads to increased airway inflammation after allergen exposure. (A and B) Number of total cells (A, Left) and eosinophils (A, Right) and number of PMNs, macrophages (Mac), and lymphocytes (Lymph) (B) in the BALF from saline- and OVA-challenged WT and Lgals1−/− mice. (C) Cellular infiltration in lung tissue after H&E staining. Representative images are shown. (Scale bar, 50 µm.) (D and E) Quantitation of lung tissue eosinophils and representative images after MBP IHC (stained reddish brown). (Scale bar, 50 µm.) (F and G) Quantitation of lung tissue T cells and representative images after CD3ε IHC (stained brown). (Scale bar, 50 µm.) (H and I) Quantitation of eosinophils in peripheral blood and BM, respectively, after Hema 3 staining. Combined data (mean ± SEM) of mice from three independent experiments (n = 8–9 mice for OVA groups and n = 6 mice for saline groups in A, B, D, and F; n = 7–8 mice for OVA groups and n = 7 mice for saline groups in H and I) are shown.

