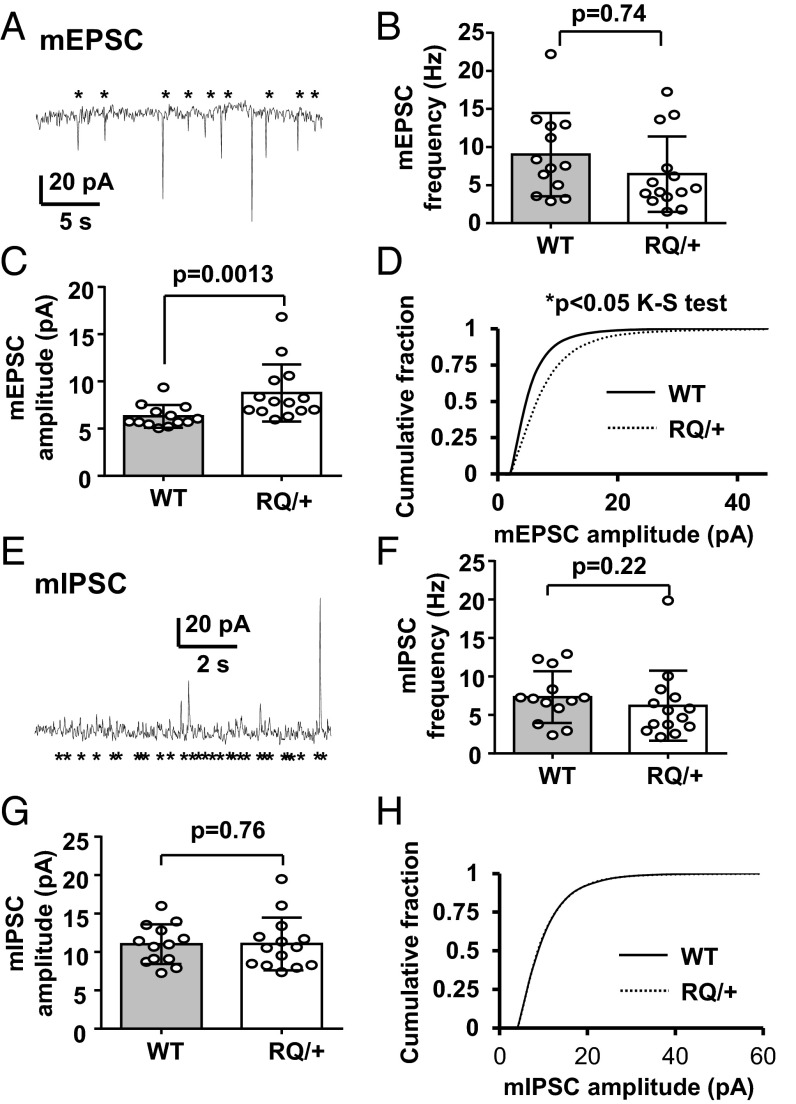
Fig. 6.
Characterization of mEPSCs and miniature IPSCs (mIPSCs) recorded in vitro from layer II/III pyramidal neurons in slices from the somatosensory cortex. (A) Representative trace of mEPSCs. An asterisk indicates a detected event. (B) There was no genotypic difference in mEPSC frequency, however in C the mean mEPSC amplitude was significantly larger in the RQ mutant. (D) Mean cumulative histogram of mEPSC amplitude distribution from WT and RQ mutant mice (P < 0.05, Kolmogorov–Smirnov test). (E) Representative trace of mIPSC recording. There were no differences in mean IPSC frequency (F) or amplitude (G). (H) Mean cumulative histogram of mIPSC amplitudes shows no difference in the distribution between genotypes. WT, 13 neurons from three mice; RQ, 14 neurons from three mice. Bar graph, mean ± standard deviation.

