Fig. 2.
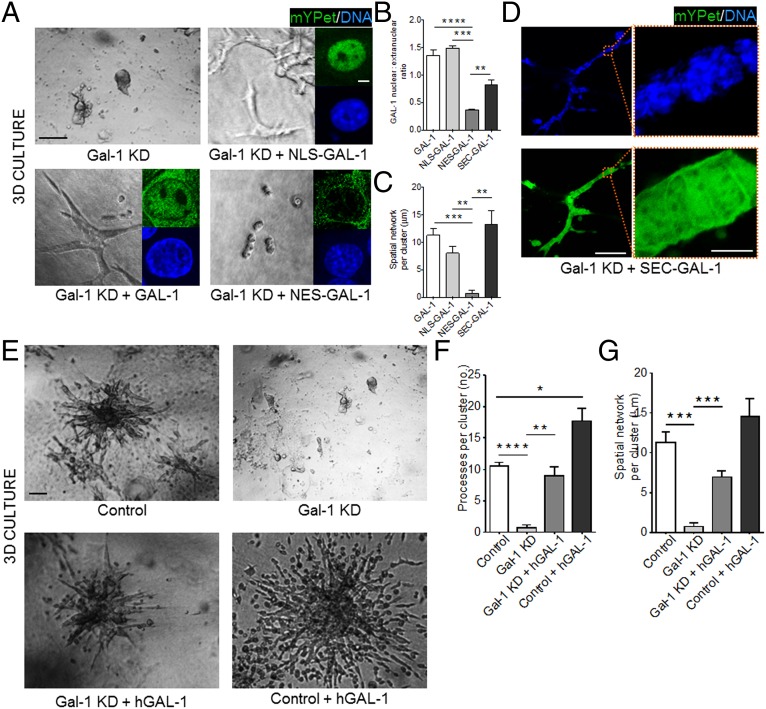
Nuclear Gal-1 drives mammary epithelial branching and migration in 3D. (A) Gal-1 KD EpH4 cells (Top, Left) ectopically expressing either NLS–GAL-1 (Top, Right), GAL-1 (Bottom, Left), or NES–GAL-1 (Bottom, Right) were cultured in 3D CL-1 gels. Branching was observed only upon expression of GAL-1 or NLS–GAL-1. (Scale bar, 50 µm.) (Inset) Fluorescence micrographs indicate the subcellular localization of each mYPet fusion construct [DNA (blue) and mYPet (green)] (see SI Appendix, Fig. S5 for construct map and construct controls). (Scale bar, 5 µm.) (B) Quantification of GAL-1 nuclear:extranuclear ratio for each of the GAL-1 constructs. (C) Quantification of the spatial network per cluster for each of the GAL-1 constructs in 3D (20 clusters analyzed per culture). (D) Gal-1 KD EpH4 cells ectopically expressing SEC–GAL-1 branch when cultured in a 3D CL-1 gel (Left). (Scale bar, 100 µm.) mYPet fluorescence of SEC–GAL-1 fusion construct is distributed between the extracellular space and the nucleus (Right) (see SI Appendix, Fig. S5 for construct map and construct controls). (Scale bar, 10 µm.) (E) Brightfield micrographs of EpH4 cells (Top, Left) with Gal-1 KD (Top, Right), with Gal-1 KD and treatment with recombinant human GAL-1 (Bottom, Left), and with recombinant human GAL-1 (Bottom, Right) cultured in 3D CL-1 gels. (Scale bar, 50 µm.) (F and G) Quantification of the number of processes per branching cluster and the spatial network of each cluster upon endogenous Gal-1 KD and/or treatment with recombinant human GAL-1. For all bar graphs, error bars represent S.E.M. Statistical significance is given by *P < 0.05; **P < 0.01; ***P < 0.001; ****P < 0.0001.

