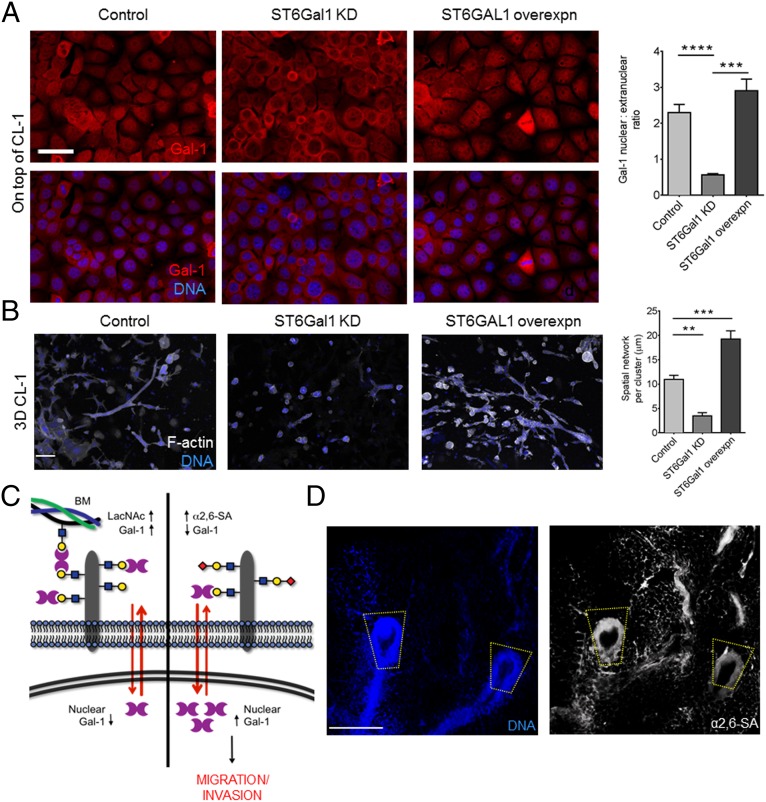
Fig. 5.
α2,6–SA regulates Gal-1’s nuclear abundance and induction of mammary epithelial morphogenesis. (A) Fluorescence micrographs of EpH4 cells cultured on top of CL-1 and stained for Gal-1 (red) and DNA (blue): wild-type cells (Left), cells with ST6Gal1 knockdown (Middle), and cells overexpressing ST6GAL1 (Right) (see SI Appendix, Fig. S9E Extended Data Fig 9e for α2,6–SA levels of EpH4 cells with ST6Gal1 depletion and overexpression). Quantification of Gal-1 nuclear:extranuclear ratio of EpH4 cells with varying levels of ST6Gal1. (Scale bar, 25 µm.) (B) Fluorescence micrographs of EpH4 cells cultured in 3D within CL-1 gels and stained for F-actin (depicted in white) and DNA (depicted in blue): wild-type cells (Left), cells with ST6Gal-1 knockdown (Middle), and cells overexpressing ST6Gal-1 (Right). Quantification of the spatial network per cluster of EpH4 cells with varying levels of ST6Gal1 (50 clusters counted per culture). (Scale bar, 25 µm.) (C) Complete model of glycan signatures regulating nuclear Gal-1 in mammary epithelial cells. α2,6–sialylation of LacNAc structures causes Gal-1 to accumulate in the nucleus, resulting in an invasive phenotype (Right). (D) Fluorescence micrographs of murine mammary gland stained with SNA (Right; white) and DAPI (Left; blue) show high levels of α2,6–SA residues in the invasive end bud of the mammary gland. (Scale bar, 200 µm.) For all bar graphs, error bars represent S.E.M. Statistical significance is given by **P < 0.01; ***P < 0.001; ****P < 0.0001.

