Fig. 6.
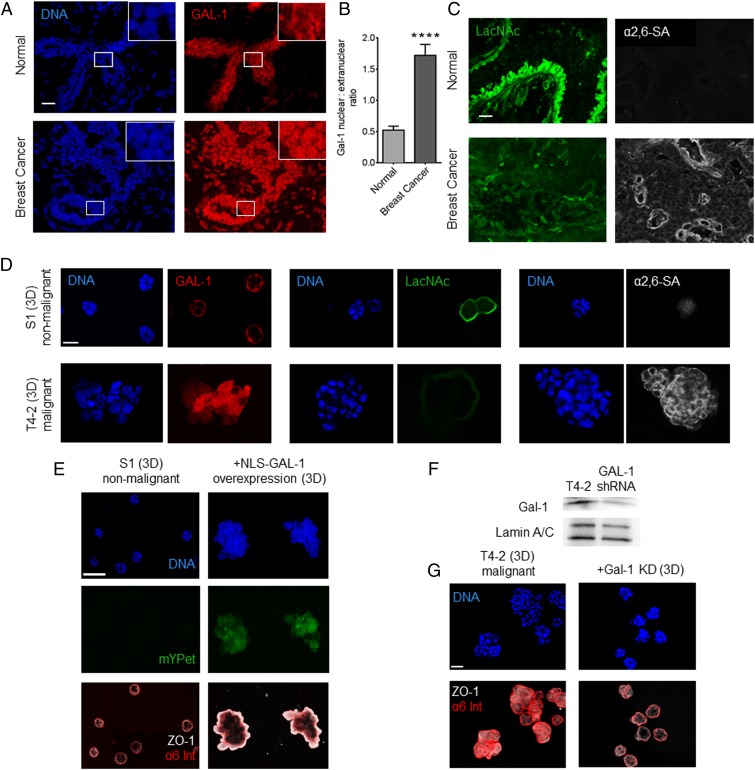
Malignant breast epithelia possess high levels of nuclear Gal-1 and α2,6–SA and low levels of LacNAc. (A) Fluorescence micrographs of sections of normal breast tissue (Top) and invasive ductal carcinoma (Bottom). The set shows staining for Gal-1 (depicted in red) and DNA (depicted in blue) with insets highlighting single cells for subcellular staining distribution. (Scale bar, 20 µm.) (B) Graph showing quantification of nuclear:extranuclear ratio of Gal-1 in breast epithelia from normal and invasive ductal carcinoma tissues. (C) Micrographs of normal breast tissue (Top) and invasive ductal carcinoma (Bottom) showing staining for terminal LacNAc residues (depicted in green, Left) and α2,6–SA (depicted in white, Right). (Scale bar, 20 µm.) (D) Fluorescence micrographs of 3D cultures formed by nonmalignant S1 cells (Top) and isogenic malignant T4-2 cells (Bottom). Staining for Gal-1 (depicted in red) and DNA (depicted in blue) (Left). Staining for terminal LacNAc residues (depicted in green) and DNA (depicted in blue) (Middle). Staining for α2,6–SA (depicted in white) and DNA (depicted in blue) (Right). (Scale bar, 20 µm.) (E) Fluorescence micrographs of 3D cultures of S1 cells, wild-type (Left) and overexpressing NLS–GAL-1 (Right). S1 cells overexpressing NLS–GAL-1 show loss of growth-arrested phenotype seen in wild-type S1 cells and aberrant basoapical polarity of basal (α6 integrin; depicted in red) and apical (zonula occludens, ZO-1; depicted in white) markers. (Scale bar, 40 µm.) (F) Immunoblot showing levels of GAL-1 (Top) and Lamin A/C (internal control, Bottom) in T4-2 cells with and without shRNA-based knockdown. (G) Fluorescence micrographs of 3D cultures of T4-2 cells (Left) and T4-2 cells with GAL-1 knockdown (Right) showing a recovery of acinar phenotype and basoapical polarity upon GAL-1 knockdown. For bar graphs, error bars represent S.E.M. Statistical significance is given by ****P < 0.0001. (Scale bar, 20 µm.)

