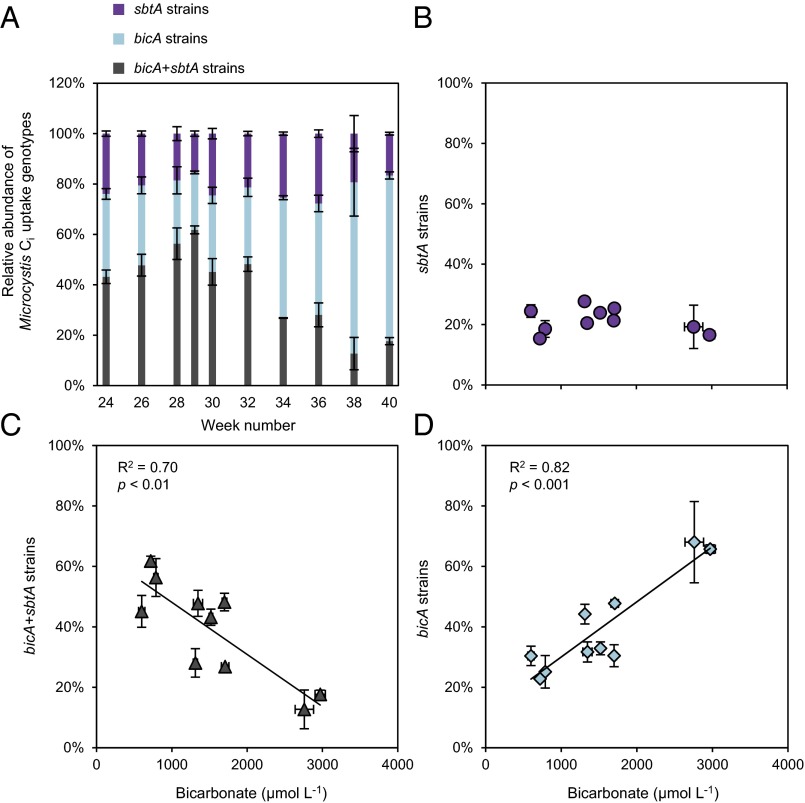
Fig. 4.
Ci uptake genotypes of Microcystis in the lake study. (A) Relative abundances of the three Ci uptake genotypes (sbtA strains, bicA strains, and bicA + sbtA strains). (B–D) Relation between the relative abundances of the Ci uptake genotypes and the bicarbonate concentration. The data points show the mean (±SD) of three replicate measurements. The trend lines are based on linear regression (n = 10).

